
Cancer and neoplasms
Global, regional, and national time trends in cancer mortality attributable to high fasting plasma glucose: an age-period cohort analysis
Jul
Rapidly increasing risk factors for cancer mortality worldwide, 1990–2019
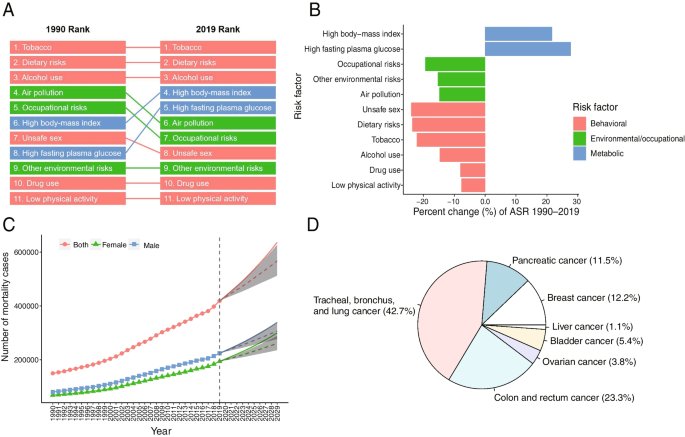
The number of cancer deaths attributable to HFPG worldwide in 2019 was 419,340 (95% CI 115,730–848,480). In the global range, tobacco consumption, dietary risks, and alcohol consumption (top three from high to low) were still risk factors that caused the most cancer deaths in 2019 when compared with 1990. However, the number of cancer deaths attributable to HFPG rose from the eighth (1990) to the fifth rank (2019) (Fig. 1A), the largest increase among all risk factors (Fig. 1B), followed by high body-mass index.
Rapid causes of cancer mortality worldwide, 1990–2019. A Risk factors ranking for age-standardized cancer death rates for the global, 1990–2019; (B) Percent change of risk factors contributing to age-standardized cancer death rates for the global, 1990—2019; (C) Prediction of the number of cancer deaths attributable to HPFG from 2020 to 2029 for the global; (D) Proportions of cancer deaths attributable to HFPG by subtype for the global in 2019
Its percentage increase of ASMR attributable to HFPG in the whole population over the past 30 years was 27.8%, 28.1% higher than that of the second risk factor (the increased percentage of ASMR attributable to high body-mass index in the past 30 years was 21.7%). For the female population, in particular, the percentage increase of ASMR was 175.3% higher than that of the second risk factor (Supplement Table S1, Figure S1-A). Based on the BAPC model, the number of cancer deaths attributable to HFPG was predicted to continue to rise to 636,166 by 2029 (Fig. 1C). The top four cancer subtypes were “trachea, bronchus and lung cancer”, “colon and rectal cancer”, “breast cancer” and “pancreatic cancer”, accounting for 89.7% of the total number (Fig. 1D). It should be noted that the cancer types corresponding with the most deaths in females were different from those in males. The most common cancers in males were “trachea, bronchus, and lung cancers”, “colon and rectal cancer” and “pancreatic cancer”. Among females, the top three were “trachea, bronchus and lung cancer”, “breast cancer” and “colon and rectal cancer”. Among the cancer subtypes, breast cancer accounted for a large proportion (26.3%) in females (Supplement Figure S1-B).
Global and regional trends in cancer mortality attributable to HFPG, 1990–2019
The age-standardized rate of mortality in 2019 (total of 204 countries), as well as the percent change from 1990 to 2019, are shown in Fig. 2. Table 1 shows the population, the total number of deaths, the all-age rate, the age-standardized rate, and the net drift for mortality. From 1990 to 2019, the global population increased from 5.35 billion (95% CI, 5.24–5.46) to 7.74 billion (95% CI, 7.48–7.99), representing an increase of 44.67%. However, the number of cancer deaths attributable to HFPG increased from 150.10 thousand (95% CI, 39.21–312.37) to 419.34 thousand (95% CI, 115.73–848.48), an increase of 179.37%, more than four times the global population growth rate. The mortality rate in all SDI areas showed an upward trend, especially in middle, low middle and low SDI areas. In 2019, the age-standardized mortality rate in the total population ranged from 7.22 (95% CI, 2.04–14.45) in the high SDI areas to 2.64 (95% CI, 0.72–5.49) in the low SDI areas (Table 1). The highest mortality for males was found in the high SDI areas, which was 8.70 (95% CI, 2.23–18.04) (Supplement Table S2).

The age-standardized rate in 2019 (A) and percent change (%) of the age-standardized rate during 1990–2019 (B) for cancer mortality attributable to HFPG
The net drift for mortality ranged from 0.52% (95% CI, 0.47–0.56) per year in areas with high SDI to 1.75% (95% CI, 1.61–1.90) per year in areas with low SDI between 1990 and 2019 (Table 1). The net drift of mortality in low SDI areas for females was the highest, reaching 2.33% (95% CI, 2.12–2.55) (Supplement Table S2). Meanwhile, the results of global and regional trend analyses of mortality for specific cancer subtypes exhibited a similar trend, as shown in Supplemental Tables S3-S6.
National trends in cancer mortality attributable to HFPG, 1990–2019
Among the 204 countries and territories worldwide, China (90,655 deaths; 95% CI, 23,078–197,161), the United States of America (58,134 deaths; 95% CI, 16,747–114,100), India (30,220 deaths; 95% CI, 8,320–62,897) and Germany (19,416 deaths; 95% CI, 5,634–38,269) were the top four countries in terms of cancer deaths. The top four countries accounted for 47.3% of global deaths. At the same time, 150 countries and territories showed annual net drift ≥ 1.0%. An annual net drift increase of 1% means that the number of deaths would increase by 10%, 18% and 26% in the next 10, 20 and 30 years, respectively [19]. Among 204 countries and territories, Uzbekistan at 4.56% (95% CI: 3.79–5.33), Georgia at 4.52% (95% CI: 3.82–5.24), Lesotho at 4.36% (95% CI: 2.46–6.29), Cabo Verde at 4.29% (95% CI: 0.02–8.73), and Egypt at 4.24% (95% CI: 3.80–4.68) were the top five countries with the fastest increase (Supplement Table S7).
In general, these results suggest that the overall disease burden is increasing in most countries and territories of the world. Countries and territories with higher levels of SDI generally had higher mortality, yet the numbers increased relatively slowly. Although most of the countries and territories with low SDI levels had relatively low mortality, the numbers were rapidly increasing.
The age-standardized mortality rates and the percentage changes with SDI level in a total of 204 countries and territories are shown in Fig. 3. Countries with high SDI levels have higher age-standardized mortality rates, while countries with low SDI levels have higher percent change values. The specific cancer subtypes exhibited similar trends, as shown in Supplemental Figures S2-5.

The age-standardized mortality rates in 2019 (A) and percent change (%) in the age-standardized rate during 1990–2019 (B) for 204 countries and territories by sociodemographic index
Time trends of distribution in mortality attributable to HFPG among different age groups
Figure 4 shows the net drift and local drifts for global and SDI quintile regions. Higher net drift values were found in lower SDI regions. Globally, cancer mortality attributable to HFPG showed increasing trends across all age groups (p < 0.05), and the trend intensified with age. The largest mortality increase occurred in the 84–89 years group, and the local drift value was 1.60% (95% CI: 1.45–1.75). The mortality rate of females increased faster than that of males globally. In high-, high-middle-, and middle-SDI regions, older people experienced a faster mortality increase, while in low-middle- and low-SDI regions, younger people experienced a faster mortality increase. Tracheal, bronchus, and lung, breast and pancreatic cancer had similar trends to neoplasm, while colon and rectal cancer in the 50–55 and 85–89 year groups had a relatively high death rate increase, as shown in Supplemental Figures S6-9.

Local drifts of cancer mortality attributable to HFPG by SDI quintiles, 1990–2019
Figure 5 shows the time trend of deaths with the age distribution, which represents the survival status for cancer. From a global perspective, the time trend of deaths in the elderly population (80 + years) gradually increased and did not differ by gender. This trend was clearer in countries with high and high-middle SDI levels. It was noted that the number of deaths below 80 years was still in the minority in countries with middle, low-middle and low SDI, which might be related to the short average lifespan in these countries. Death according to cancer subtypes also exhibited the same trend, as shown in Supplemental Figures S10-13.

Age distribution of cancer deaths attributable to HFPG by SDI quintiles, 1990–2019
Age-period-cohort effects on mortality attributable to HFPG
The age, period and cohort effects estimated by the APC model for mortality across SDI quintiles are shown in Fig. 6. A similar age-effect pattern was found across countries and territories with different SDI levels. Elderly individuals aged 85 to 89 had the highest risk, which gradually increased with age from 50 to 89 years old. The mortality of all age groups was generally higher in countries with high SDI and high-middle SDI. In addition, the risk of death in males was higher than that in females across SDI quintiles. Although an increase in mortality was observed across SDI quintiles, the mortality of females in low-middle and low SDI areas rapidly increased compared with that of males.

Age, period and cohort effects on cancer mortality attributable to HFPG by SDI quintiles
There were differences in the period effects across different SDI quintiles. In terms of global trends, the risk of mortality declined in the last decade, especially in high-middle and high SDI regions. However, a sustained upward trend was observed in the middle, low-middle and low SDI regions.
Globally, the mortality risk of successive younger birth cohorts also showed a trend of differences among SDI quintiles. Similar to the period effect, the global risk of mortality increased with the birth cohort, especially in middle, low-middle and low SDI regions. However, it was noteworthy that the mortality risk of males in high and high-middle SDI regions declined (birth cohort after 1935).
The effects of age, period, and birth cohort on death in cancer subtypes are shown in Supplemental Figures S14-17. Trends in disease burden for “tracheal, bronchial, lung cancer”, “colon, rectal cancer”, and “breast cancer” were generally consistent with the overall trend. For “pancreatic cancer”, there was a more pronounced upward trend in period and birth cohort effects for all SDI areas.
Age-period-cohort effects in representative countries
Unfavourable age-period-cohort effects were observed across SDI quintiles. We selected representative countries from the five SDI levels (Fig. 7) to better describe the main trend in mortality through age-period-cohort effects across the world. The net drifts from six countries increased during the past 30 years. Notably, the net drift value for males was higher than that for females in China, where the drift (95% CI) values for males and females were 1.65 (1.52, 1.78) and 0.74 (0.60, 0.88), respectively. However, the net drift (95% CI) values for males in the United Kingdom and Italy populations were 0.03 (-0.14, 0.20) and 0.11 (-0.06, 0.27), respectively, which indicated that there was no significant increase in mortality (Supplement Table S8). Regarding the age effect, increased mortality was observed in all age groups for the six countries, which was more significant in males. In terms of the period effect, Italy was different from other countries and showed a clear downward trend. In terms of the birth cohort effect, the increasing trend slowed after 1935 for populations in the United States of America, United Kingdom, Italy, and China. However, increasing trends were observed in India and Pakistan. The age-period-cohort effects of cancer subtypes in representative countries are shown in Supplemental Figures S18-21 and Table S9-12.

Age, period and cohort effects on neoplasm mortality attributable to HFPG for representative countries