
Infection
Causal relationship between blood metabolites and risk of five infections: a Mendelian randomization study
Oct
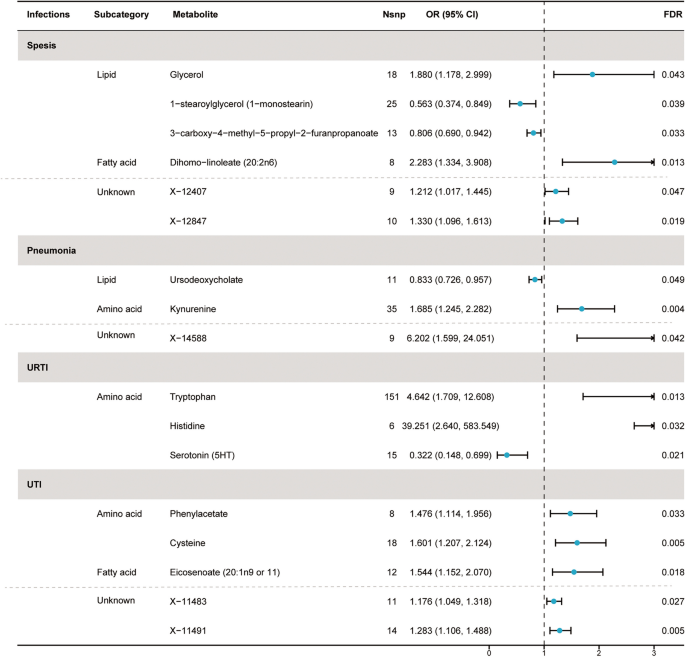
Based on preliminary instrument selection, the number of instrumental variables for metabolites ranged from 3 to 148, with a median of 13. Using these instrumental variables, we initially evaluated the causal relationships ranging from 452 metabolites to five infections and detected a total of 71 suggestive associations (P < 0.05; corresponding to 64 unique metabolites) by IVW analysis, with 40 associations in 36 known metabolites and 31 associations in 28 unknown metabolites (Supplement Table 1). Among them, 11, 7, 7, 9, and 6 associations were found for known metabolites, and 10, 5, 6, 6, and 4 associations were found for unknown metabolites, respectively related to sepsis, pneumonia, URTI, UTI, and SSTI. Importantly, the minimum F statistic was greater than 10 (ranging from 18.55 to 1431.87), indicating a low likelihood of weak instrument bias (Supplement Table 1). After the multiple-testing correction, we found 4, 2, 3, and 3 associations for known metabolites and 2, 1, 0, and 2 associations for unknown metabolites, respectively significant (FDR < 0.05) for sepsis, pneumonia, URTI, and UTI (Fig. 2). No metabolites significantly associated with SSTI were identified after multiple testing corrections. Specifically, the 7 metabolites associated with sepsis were glycerol (odds ratio [OR] = 1.88, 95% confidence intervals [CIs]: 1.178–2.999, FDR = 0.043), 1-stearoylglycerol (1-SG) (OR = 0.563, 95%CI: 0.374–0.849, FDR = 0.039), 3-carboxy-4-methyl-5-propyl-2-furanpropanoate (CMPF) (OR = 0.806, 95%CI: 0.690–0.942, FDR = 0.033), dihomo-linoleate (20:2n6) (OR = 2.283, 95%CI: 1.334–3.908, FDR = 0.013), X-12407 (OR = 1.212, 95%CI: 1.017–1.445, FDR = 0.047), X-12833 (OR = 1.071, 95%CI: 1.017–1.127, FDR = 0.047), and X-12847 (OR = 1.330, 95%CI: 1.096–1.613, FDR = 0.019).
Forest plot for the causal effect of identified metabolites on the risk of 4 types of infection phenotypes (sepsis, pneumonia, URTI, and UTI) derived from inverse variance weighted (IVW). SNP, single nucleotide polymorphism; OR, odds ratio; CI, confidence interval; FDR, false discovery rate; URTI, upper respiratory tract infection; UTI, urinary tract infection
The three metabolites causally related to pneumonia were ursodeoxycholate (UDCA) (OR = 0.833, 95%CI: 0.726–0.957, FDR = 0.049), kynurenine (OR = 1.685, 95%CI: 1.245–2.282, FDR = 0.004), and X-14588 (OR = 6.202, 95%CI: 1.599–24.051, FDR = 0.042). The three metabolites causally related to URTI are tryptophan (OR = 4.642, 95%CI: 1.709–12.608, FDR = 0.013), histidine (OR = 39.251, 95%CI: 2.640–583.549, FDR = 0.032), and serotonin (5HT) (OR = 0.322, 95%CI: 0.148–0.699, FDR = 0.021).
The five metabolites causally related to UTI are phenylacetate (PA) (OR = 1.476, 95%CI: 1.114–1.956, FDR = 0.033), cysteine (OR = 1.601, 95%CI: 1.207–2.214, FDR = 0.005), eicosenoate (20:1n9 or 11) (OR = 1.544, 95%CI: 1.152–2.070, FDR = 0.018), X-11483 (OR = 1.176, 95%CI: 1.049–1.318, FDR = 0.027), and X-11491 (OR = 1.283, 95%CI: 1.106–1.488, FDR = 0.005).
Sensitivity analysis
A series of sensitivity analyses were conducted to evaluate the robustness of our main analytical approach. Using the IVW analysis as the basis, we applied MR-Egger regression, weighted median method, and MR-PRESSO to comprehensively evaluate the causal effects between blood metabolites and the infections. The results showed that the analysis results of 12 known metabolites and 5 unknown metabolites were robust. Specifically, the consistent direction and magnitude among the three MR analysis methods are presented in Supplement Table 2 and Supplement Figure 1. After conducting tests for multiple effects and heterogeneity, the P-values derived from the Cochran’s Q test and I2 indicated no heterogeneity. In addition, we observed a negligible impact of horizontal pleiotropy as evidenced by the small intercept term in the MR-Egger analysis (Table 2). Furthermore, the absence of horizontal pleiotropy or instrumental outliers is supported by MR-PRESSO analysis (Poutlier > 0.05). Moreover, the leave-one-out analysis did not reveal any high-influence SNPs that affected the estimate of the combined effect (Supplement Figure 2). Therefore, we identified these 17 metabolites as potential candidate metabolites for further analysis, and specific results are shown in Table 2 and Fig. 2. Furthermore, to confirm the direction of the effect from metabolites to infections, we performed Steiger testing, which revealed that the identified causal relationships were not biased by reverse causation (Supplement Table 2).
Confounding analysis
Although sensitivity analyses did not reveal any evidence of bias that would render the MR estimates invalid, we conducted further manual investigations into the second trait (body mass index, body fat percentage, total cholesterol levels, and low-density lipoprotein cholesterol) of the metabolite-associated SNPs. Using Phenoscanner, we removed one SNP (rs3741298) from 1-SG, which was associated with total cholesterol levels, and three SNPs (rs1260326, rs1412972, rs603446) from tryptophan, which were associated with body fat percentage and total cholesterol levels. After performing IVW analysis again, the causal connection ranging from the metabolites to infections remained significant. Specifically, 1-SG (IVW OR = 0.573, 95%CI: 0.380–0.863, FDR = 0.015) and tryptophan (IVW OR = 4.968, 95%CI: 1.789–13.790, FDR = 0.006) were significantly associated with sepsis and URTI, respectively.
Replication and meta-analysis
In order to reinforce the robustness of our findings, we performed replication analyses by utilizing four GWAS datasets from FinnGen R8, which revealed comparable tendencies for some metabolites. with known metabolites, 2, 1, and 2, being respectively linked to the trends of sepsis, pneumonia, and UTI. Additionally, two unidentified metabolites, X-12407 and X-12847, were found to correlate with an elevated risk of sepsis. As shown in Fig. 3, specifically, joint analysis of the UK Biobank and FinnGen datasets further confirmed that high levels of 1-SG (OR = 0.746, 95%CI: 0.573–0.998, P = 0.049) and CMPF (OR = 0.875, 95%CI: 0.785–0.976, P = 0.017) were protective factors for sepsis, X-12407 (OR = 1.172, 95%CI:1.028–1.336, P = 0.018) and X-12847 (OR = 1.183, 95%CI: 1.028–1.360, P = 0.019) are risk factors for sepsis. UDCA (OR = 0.906, 95%CI: 0.829–0.990, P = 0.029) was a protective factor for pneumonia. High levels of PA (OR = 1.287, 95%CI: 1.048–1.579, P = 0.016) and cysteine (OR = 1.310, 95%CI: 1.082–1.586, P = 0.006) predicted a higher risk of UTI.

Meta‑analysis of the causal associations between metabolites and 3 types of infection phenotypes (sepsis, pneumonia, and UTI). OR, odds ratio; CI, confidence interval; UTI, urinary tract infection
We observed null estimates in tryptophan, serotonin (5HT), dihomo-linoleate (20:2n6), glycerol, kynurenine, histidine, eicosenoate (20:1n9 or 11), X-14588, X-11483, and X-11491 in the meta-analysis. Moreover, replication analyses using the GWAS summary data from FinnGen database revealed divergent directions. Details can be found in Supplement Figure 3.
Multivariable and reverse MR Analysis
Additionally, the Meta-analysis findings suggest that several metabolites may affect both sepsis and pneumonia. To explore the unique effects of each metabolite on sepsis or pneumonia, we performed a multivariable MR analysis. Interestingly, we found that the causal effect of each metabolite was consistent in direction and magnitude with the unadjusted results obtained through the IVW method (Table 3). Sepcifically the four metabolites that had independent causal effects on sepsis were 1-SG (OR = 0.561, 95%CI: 0.403–0.780, P < 0.001), CMPF (OR = 0.780, 95%CI: 0.6899–0.883, P < 0.001), X-12407 (OR = 1.294, 95%CI: 1.131–1.481, P < 0.001), and X-12847 (OR = 1.344, 95%CI: 1.152–1.568, P < 0.001). In addition, significant causal effects were observed for PA (OR = 1.426, 95%CI: 1.152–1.765, P = 0.001) and cysteine (OR = 1.522, 95%CI: 1.170–1.980, P = 0.002) on UTI.
Finally, to further investigate the causality between metabolites and infection phenotypes, we conducted a reverse MR analysis using instrumental variables that represent sepsis, pneumonia, and UTI, respectively. By selecting top independent SNPs with a significance level of P < 1 × 10⁻⁵ as instrumental variables and performing MR estimation, we sought to determine if there was any evidence of a reverse causal correlation from the 7 identified metabolites to the four infections. However, our analysis revealed limited support for such a relationship, as demonstrated by Supplement Table 3.