
Infection
Epidemiologic characteristics of high-risk HPV and the correlation between multiple infections and cervical lesions
Oct
In the present survey, 19.49% of the HPV-positive samples had multiple HR-HPV infections. All 20,059 samples were divided into 10 age groups (≤ 20 years, 21–25 years, 26–30 years, 31–35 years, 36–40 years, 41–45 years, 46–50 years, 51–55 years, 56–60 years, and > 60 years). There were only 7 people in the ≤ 20 years age group, thus they were not included in the data analysis. Of the HPV-positive samples, 19.49% (538/2760) had multiple HR-HPV infections. The HPV overall infection prevalence in different age groups (21–25 years, 26–30 years, 31–35 years, 36–40 years, 41–45 years, 46–50 years, 51–55 years, 56–60 years, and > 60 years) was 13.41%, 13.45%, 12.82%, 11.60%, 12.30%, 12.72%, 15.03%, 17.69%, and 23.00%, respectively. The overall HPV-positive rate was highest in the > 60 years age group, followed by the 56–60 and 51–55 years age groups. The HPV multiple infection prevalence in different ages (21–25 years, 26–30 years, 31–35 years, 36–40 years, 41–45 years, 46–50 years, 51–55 years, 56–60 years, and > 60 years) was 4.62%, 2.42%, 2.41%, 1.67%, 1.72%, 2.67%, 2.76%, 3.95%, and 7.14%, respectively. There was a typical bimodal pattern among multiple HPV infections, with a peak in the younger group and a second peak in the elderly group. A bimodal pattern was not present in the prevalence of single HR-HPV infections (Table 1).
HPV-52, HPV-58, HPV-16, HPV-51, and HPV-39 were the most common HR-HPV genotypes, accounting for 4.74% (951/20,052), 2.13% (427/20,052), 1.98% (397/20,052), 1.22% (245/20,052), and 1.17% (235/20,052) of HR-HPV infections, respectively.
For each individual HPV age trend, HPV-16, HPV-39, HPV-51, HPV-56, and HPV-66 exhibited a bimodal pattern. These genotypes were increased in the 21–25 and 26–30 year age groups, then began to decline and increased again in the 51–55 year age group, with a peak in the > 60 year age group. The other HR-HPV genotypes did not exhibit a bimodal trend (Table 2).
HPV-52, HPV-58, HPV-16, HPV-39, and HPV-56 were the most common multiple infections, accounting for 1.25%, 0.75%, 0.63%, 0.49%, and 0.48%, respectively. Most multiple HPV genotypes exhibited a bimodal pattern, except HPV-33 and HPV-82 (Table 3).
Among all HR-HPV genotypes, each HR-HPV genotype was more frequently detected in patients with multiple HPV infections than single HPV infections (Table 4; p < 0.05).
The correlations between overall single/multiple HPV infections and different cervical lesions were analyzed. There were 2222 cases of HPV single‐type infections grades as follows: normal, 87.58% (1946/2222); ASCUS, 6.17% (137/2222); LSIL, 4.14% (92/2222); and HSIL, 1.94% (43/2222). Of the 538 patients with multiple HPV genotype infections, the grades were as follows: normal, 80.11% (431/538); ASCUC, 7.25% (39/538); LSIL, 7.81% (42/538); and HSIL, 4.28% (23/538).
NMIL was more frequent in single HPV infections than HPV multiple infections. HSIL and LSIL were more frequent in multiple HPV infections than single HPV infections (p < 0.05). ASCUS was also more frequently detected in multiple HPV infections (37/236 [15.7%]) than single HPV infections, although the difference was not statistically significant (Table 5).
The most common HPV type in patients with HSIL was HPV-16, followed by HPV-52, HPV-58, and HPV-33. Among patients with LSIL, HPV-52 was the most common type, followed by HPV-58, HPV-66, and HPV51. Among patients with ASCUS, HPV-52, followed by HPV-58, HPV-16, and HPV-68 were the most common HPV types. The most common multiple HPV types in patients with HSIL was HPV-16 (56.52%), HPV-52 (47.83%), HPV-58 (21.74%), HPV-33 (17.39%), and HPV-66 (17.39%). The most common single HPV types in patients with HSIL was HPV-16 (37.21%), HPV-52 (23.26%), HPV-58 (13.95%), HPV-33 (13.95%). The cell abnormalities caused by HPV-45 and HPV-82 were lower than the cell abnormalities caused by other genotypes, whether a single or multiple infection. Only one patient with a single HPV infection and ASCUS was caused by HPV-45, and only one patient with multiple HPV infections and LSIL was caused by HPV-82 (Table 6).
We then performed follow-up evaluations of patients with additional biopsies in our hospital (including 144 single and 69 multiple infections). In the single HPV infection group, 4, 3, 2, and 2 of the 12 patients with cervical cancer were positive for HPV-16, HPV-58, HPV-33 and HPV-18, respectively. HPV-16 was also the most prevalent genotype among patients with cervical cancer and multiple HPV infections, followed by HPV-58, HPV-52, and HPV-18 (Table 7).
Among the different cervical pathologic grades, patients with cervical cancer had the higher percentage of multiple HPV infections (50%) compared to chronic cervicitis (21.13%) and the difference was statistically significant (P < 0.05). The multiple HPV infections in CIN3 (36.22%), CIN1-CIN2 (32.84%) were both lower that in cervical cancer, higher that in chronic cervicitis, although the difference was not statistically significant (Table 8).
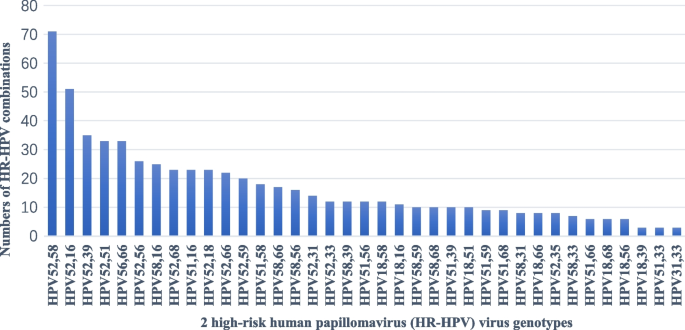
In the current study the most common HPV genotype combinations were HPV-52 + HPV-58 (71 cases) and HPV-52 + HPV-16 (51 cases). The other common multiple HPV infections were HPV-52 + HPV-39 (35 cases), HPV-66 + HPV-56 (33 cases) and HPV-51 + HPV-52 (33 cases) (Fig. 2).
Distribution involving 2 high-risk human papillomavirus (HR-HPV) virus genotypes in patients with multiple infections
Women with multiple infections were at increased risk of LSIL (OR, 2.01; 95% CI, 1.38–2.93) and HSIL (OR, 2.28; 95% CI,1.36–3.81) when compared with single infections. The odds ratios (ORs) and 95% confidence intervals (CIs) in patients with abnormal cytology and multiple infections were calculated for each HPV genotype and compared with single infections. For HPV-52, co-infection with additional HR-HPV types increased the HSIL (OR, 3.18; 95% CI, 1.33–7.58) and LSIL risk (OR, 3.11; 95% CI, 1.63–5.94) when compared to single infections. For HPV-39, co-infection with additional HR-HPV types increased ASCUS risk (OR, 4.18; 95% CI, 1.08–16.08) when compared with single infections. For each HPV types (58, 16, 33, 66, 68) co-infection with additional HR-HPV types marginally increased compared with single infections (Table 9).
Under normal conditions, the OR of single infections was higher than multiple infections. In the current study the most common multiple infections were a9 genotypes 16, 31, 33, 35, 58,66, 56, 51, and 52). Therefore, we evaluated evidence for type-type interactions on cervical disease risk (Table 10). Several genotypes acted in combination to increase the risk of HSIL. The synergy indices of HPV-33 and HPV-16 (OR, 2.08; 95% CI, 1.38–3.14), and HPV-33 and HPV-52 (OR, 4.56; 95% CI, 2.60–8.04) were > 1.0 in HSIL. The majority of other synergy indices were not estimated. There may be evidence for an HPV-33 and HPV-31interaction in increasing LSIL risk. The synergy index was 47.14(95% CI, 10.51–211.48) in LSIL. In addition, the synergy index did not increase significantly in the interaction of other a9 genotypes for HSIL and LSIL (Table 10).