
Cancer and neoplasms
Risk prediction of second primary malignancies in patients after rectal cancer: analysis based on SEER Program
Oct
Characteristics of patients
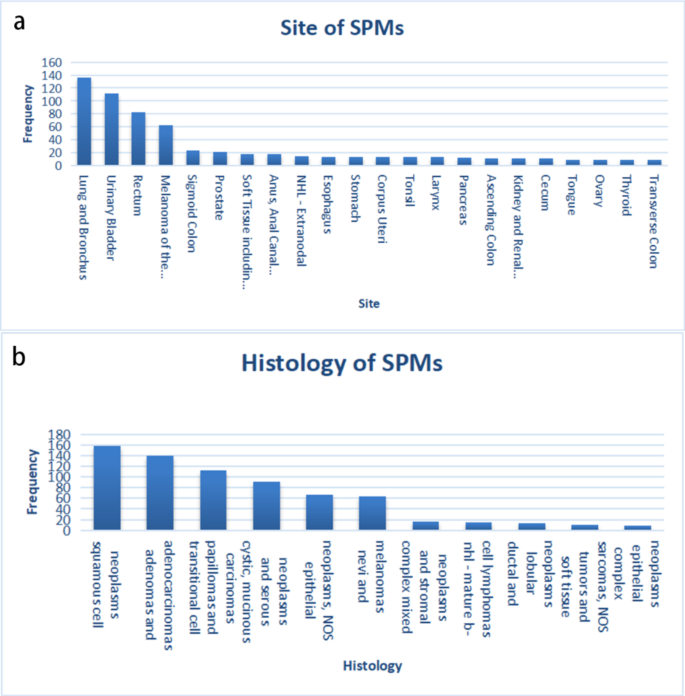
A total of 51,611 patients diagnosed with rectal cancer during 2004–2013 was obtained from the SEER database, of which 4,374 patients were diagnosed with cancer more than 6 months after the initial diagnosis of RC. To rule out caused recurrence and metastasis of RC, the patient’s data with the same histological type as RC was ruled out. Ultimately, a total of 1838 (3.56%) patients diagnosed with SPMs were identified. The results showed that the median interval between RC and SPMs diagnosis was 36 months and the median age at SPMs diagnosis was 67.5 years. By using original data obtained from the SEER database, 741 cases of SPMs were found. After removing those with unclear clinical information, more than 1% of the patients’ SPM sites and histological types were listed (Fig. 2), suggesting that the three most common sites for SPMs were the Lung and Bronchus (18.35%), Urinary Bladder (15.11%), and Breast (11.20%) (Table 1) (Table S1). The three most prevalent histological types for SPMs were Squamous Cell Neoplasms (21.32%), Adenomas and Adenocarcinomas (18.76%), Transitional Cell Papillomas and Carcinomas (15.11%) (Table 1) (Table S2).
Features of second primary malignancies (SPMs) after rectal cancer (RC). (a) Sites of SPMs that over than 1%, (b) Histology types of SPMs that more than 1%
Final enrollment for further analysis included 741 patients in total, both the training set (N = 585) and the validation set (N = 156) were randomly divided from the 741 patients. Meanwhile, there was no significant difference in clinical information by using the χ2 test (P > 0.05), including the site of SPMs, histology of SPMs, age, race, TNM stage, treatment information, tumor size, and grade of SPMs (Table 2). The training set was used to build the nomogram and verify the model internally, while the validation set was utilized for external validation.
Prognostic factors selection and nomogram construction
Univariate and multivariate Cox regression analysis was applied to reveal OS-related factors in SPMs. The results (Table 3) show that the OS of SPMs was a significantly higher risk with age, TNM stage, stage M of RC, SPMs surgical history, SPMs tumor size (P < 0.001) and site(P = 0.009), while the OS of SPMs was a significantly lower risk with chemotherapy and radiotherapy(P<0.001). Multivariate Cox regression analysis revealed that age, stage-M, stage-M of RC, and SPMs surgical history(P<0.001), stage-T(P = 0.003), and stage-N(P = 0.012) were independent predictive variables for SPMs survival. According to the results of univariate and multivariate Cox regression analysis, 9 parameters including the site, age, stage TNM, stage M of RC, SPMs surgical history, SPMs radiotherapy records, SPMs chemotherapy records, and SPMs tumor size were used to establish a nomogram for predicting 1-, 3-, and 5-year OS (Fig. 3). To use the nomogram more conveniently, each of these characteristics was allocated a particular point on the scale. A total point was received for the individual patients, followed by a summary of the points from each parameter. Then, the probability of OS occurrence after 1, 3, and 5 years was predicted by transferring the entire score to the nomogram’s total score table. As an example, the total point of all variables for an SPM patient diagnosed with 60 years in urinary bladder site of 5 cm Tumor size, T2N2M0, M0 of RC, having SPMs Surgery record and Radiation record, but no chemotherapy record was 135, which corresponded to 1-,3-, and 5- year OS rates of about 88.3%,62.5%, and 50.1%, respectively.

Nomogram to predict 1-,3- and 5-year survival for second primary malignancies (SPMs); MS: Lung and Bronchus; UB: Urinary Bladder; LB: Melanoma of the Skin; Others: Less than 5%
Performance and validation of the nomogram
To assessed the discriminative potential of the constructed nomogram in this study, C-index in the training set 0.691 (95% CI, 0.662–0.720) and validation set 0.731 (95% CI, 0.676–0.786) was calculated, indicating that the nomogram has moderate accuracy. To assessed the correctness of our model, calibration plots were utilized to verify the consistency of our prediction and actual outcomes. The 1-, 3-, and 5-year 0 S calibration curves fit well with the 45° diagonal, indicating an excellent performance of the nomogram (Fig. 4). Meanwhile, the time-dependent ROC curves at 1-,3-and 5-year illustrated that the nomogram was more accurate in predicting OS prognosis in the training set 0.79 (95%,0.73–0.85),0.74 (95, 0.69–0.78) and 0.74 (95%,0.69–0.78), and validation set 0.72 (95%CI,0.58–0.85),0.72 (95%CI,0.64–0.80), and 0.70 (95%,0.62–0.79) (Fig. 5), respectively.

The calibration curve to evaluate the 1-year(a),3-year (c) and 5-year (e) survival for second primary malignancy (SPM) patients in the training set; The calibration curve to evaluate the 1-year(b),3-year (d) and 5-year (f)survival for SPM patients in the validation set

The ROC of 1-, 3-, and 5-year of the training (a) and validation (b) sets
As shown in Fig. 6, DCA curves showed that the nomogram could more accurately forecast the likelihood of OS occurring after 1, 3, and 5 years, which, in both groups, may offer greater net clinical advantages than the AJCC stage model. Furthermore, we utilized the NRI and IDI to compare the accuracy of the nomogram with the usual AJCC staging system (Table 4). In the training set, the NRI for 1-3- and 5-year OS were 0.247(95%CI 0.022–0.503), 0.445(95%CI 0.363–0.689) and 0.445(95%CI 0.363–0.689), while the NRI for 1-3- and 5-year OS were 0.247(95%, CI 0.024–0.506), 0.445(95%, CI 0.299–0.682) and 0.075(95%CI 0.400–0.720) in the validation set. Additionally, the INI for 1-3- and 5-year OS were 0.030(P<0.001),0.072(P<0.001), and 0.080(P<0.001) in the training set, and 0.068(P<0.001),0.131(P<0.001) and 0.141(P<0.001) in the validation set. The NRI and IDI results demonstrated that the accuracy of the nomogram to predict OS is much superior than the usual AJCC staging system.

DCA curves of the nomogram and AJCC TNM staging system for predicting 1-,3- and 5-year OS in the training set (a, b, c), the internal validation set (d, e, f)
Finally, a risk score for each patient was calculated by nomogram with an establishment of risk stratification (Fig. 7). In both the training (Fig. 7A) and validation (Fig. 7B) sets, the Kaplan-Meier survival curves displayed remarkable statistical difference between high and low-risk individuals (p<0.001).

Kaplan-Meier curves of OS for risk score in the training set(P<0.001) (a), the internal validation set(P<0.001)(b)