
Cardiovascular
Prognostic significance of the stress hyperglycemia ratio in critically ill patients
Oct
Study design
In this investigation, a retrospective cohort study was undertaken utilizing the comprehensive Medical Information Mart for Intensive Care IV (MIMIC-IV, version 2.0), a robust US-based database. This repository encompasses an extensive array of health-related data originating from 76,943 unique ICU admissions, encompassing 53,150 distinct patients who underwent critical care at the Beth Israel Deaconess Medical Center over the time span from 2008 to 2019 [12]. Within this context, one of the authors, Le Li, received proper authorization to access the database, and was attributed a designated Record ID of 35,965,741. To ensure the utmost protection of patient privacy, all personally identifiable information underwent meticulous de-identification procedures. It’s worth noting that since our study is centered around the analysis of a third-party anonymized and openly accessible database, which had already received the approval of an institutional review board (IRB), the IRB review process at our own institution was appropriately determined to be exempted.
Cohort selection
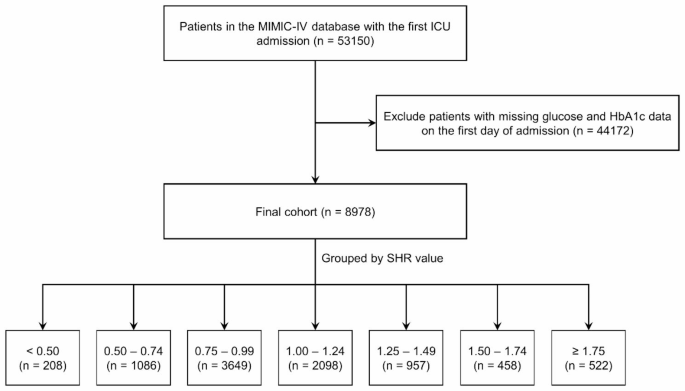
Our study encompassed patients who were admitted to the ICU for the first time, and those who did not undergo glycosylated hemoglobin A1c (HbA1c) or glucose tests within the initial 24 h after admission were excluded from the analysis. It is important to underscore that within the MIMIC-IV 2.0 database, individuals aged below 18 years were automatically excluded. Following these criteria, a total of 8,978 patients were selected for inclusion in the ICU analysis (Fig. 1). Based on the SHR levels, the patient cohort was divided into seven distinct groups, with intervals of 0.25, spanning from < 0.50 to ≥ 1.75.
Flow chart. ICU: intensive care unit; SHR: stress hyperglycemia ratio
Variable extraction
The variables collected in this study include patient demographics (age, sex, weight), common comorbidities (diabetes mellitus [DM], hypertension, myocardial infarction [MI], chronic kidney disease [CKD] et al.), survival outcomes (in-hospital mortality and 1-year mortality), severity score (SAPS-II, LODS, et al.), laboratory parameters (white blood cell [WBC], hemoglobin [HGB], serum creatinine [SCr], blood urea nitrogen [BUN]), medication and interventions (insulin, vasopressor, diuretics and mechanical ventilation [MV]), and other relevant variables. The SHR was calculated as follows:
$$text{S}text{H}text{R}=text{A}text{B}text{G} (text{m}text{g}/text{d}text{L}) / (28.7times text{H}text{b}text{A}1text{c} (text{%})-46.7)$$
Glucose and HbA1c values were using the first record after ICU admission. All comorbidities were identified based on ICD-9 or ICD-10 codes. Information regarding hospitalization within the initial 24 h following ICU admission was meticulously extracted from the MIMIC-IV database through the utilization of PostgreSQL (version 14.0). This study adhered to the Strengthening the Reporting of Observational Studies in Epidemiology (STROBE) guidelines for observational studies [13].
Outcomes
The primary endpoint was in-hospital all-cause mortality, with 1-year all-cause mortality serving as the secondary endpoint. However, it’s crucial to highlight that the MIMIC-IV database restricts access to death dates beyond one year from the last hospital discharge. Consequently, the database does not facilitate insights into patient mortality beyond the one-year timeframe, which restricts the utilization of MIMIC-IV data for inferences related to deaths occurring beyond that period.
Statistical analysis
All analyses were performed using R software (version 4.1.0), and 2-side P < 0.05 was considered statistically significant. Categorical variables were presented as proportions, while continuous variables were depicted as either mean (standard deviation, SD) or median (interquartile range, IQR). The Wilcoxon test was employed to compare continuous variables, while categorical variables were subjected to analysis using the chi-square test. To evaluate the associations between various SHR levels and the likelihood of in-hospital and 1-year mortality, we employed multivariate logistic and Cox regression models, respectively, generating odds ratios (ORs) or hazard ratios (HRs) accompanied by their respective 95% confidence intervals (CIs). Additionally, we conducted Kaplan-Meier survival analysis to assess the incidence rates of the primary outcome event within SHR-defined groups, with inter-group disparities assessed via the log-rank test. Furthermore, the relationship between SHR levels and mortality risk was examined using restricted cubic spline (RCS) curves. The reference group for this analysis was defined as the SHR interval with the lowest incidence rate. To evaluate the potential enhancement in the predictive accuracy of adverse outcome events by incorporating SHR into the existing severity of illness scores (including SOFA score, LODS score, SAPS-II, and Charlson score), the area under the curve (AUC) was calculated. Subsequently, the distinct models were compared using the DeLong test.
The multivariate logistic and Cox regression analyses included adjustments for pertinent baseline factors encompassing demographic parameters (age, sex, weight), medical history (hypertension, DM, MI, and CKD), and interventions (history of insulin use, vasopressors, MV). Additionally, subgroup analyses were conducted, stratifying outcomes based on age, sex, the presence of comorbidities (DM, hypertension, acute MI, and CKD), as well as primary interventions (vasopressors and MV). These subgroup analyses were performed using comprehensive regression models that were adjusted for confounding factors.