
Infection
Spatio-temporal disparities of Clonorchis sinensis infection in animal hosts in China: a systematic review and meta-analysis – Infectious Diseases of Poverty
Oct
Literature selection and quality assessment
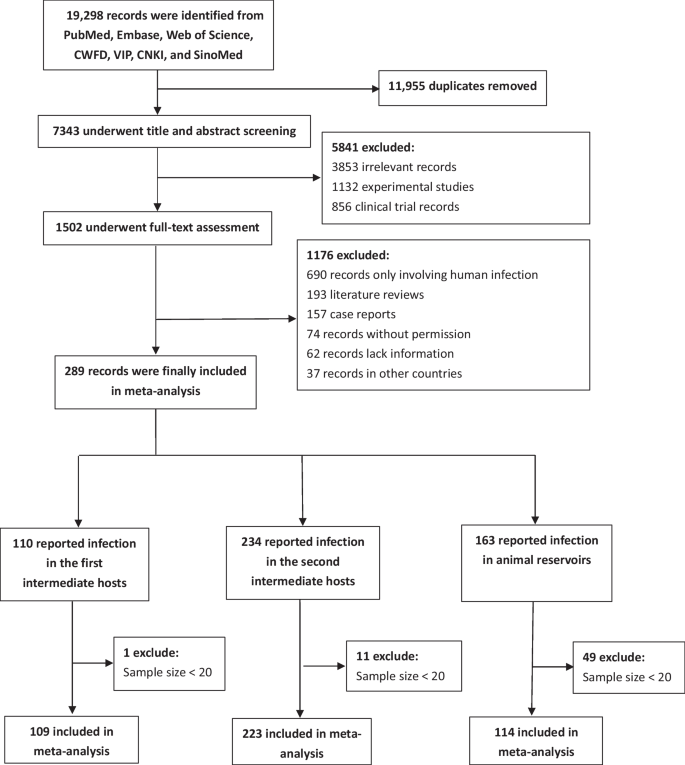
A total of 19,298 publications were identified through the online database search. After removing duplicates, 7343 were excluded based on title and abstract screening. Following full-text assessment, 289 publications were found to meet the inclusion criteria and were included in subsequent analyses. Of the included publications, 109 reported infections in freshwater snails, 223 in the second intermediate hosts, and 114 in animal definitive hosts (Fig. 1).
Flow diagram of study selection. Of all the articles included in the study, 38 included freshwater fish and freshwater snail infections, 12 included freshwater fish and reservoir hosts infections, 9 included freshwater snail and reservoir hosts infections, and 41 included freshwater fish, freshwater snail, and reservoir hosts infections
For the risk of bias assessment, risk of bias scores ranged from 2–5 (low to moderate biases). To be specific, 80 out of 109 publications for snails, 157 out of 223 for the second intermediate host, and 103 out of 114 for animal reservoirs were rated as low bias. The most common risk was lack of random selection of the sample or lack of reporting detecting method used to measure C. sinensis infection. The basic characteristics of the included articles, extracted data, and quality assessment results can be found in Additional file 10: Table S2, Additional file 11: Table S3, Additional file 12: Table S4.
C. sinensis infection in the first intermediate hosts
A total of 109 articles covering 210 data points and 452,969 snail samples were finally included in the meta-analysis to estimate the pooled prevalence of C. sinensis infection in the first intermediate host. The prevalence of C. sinensis in snails ranged from 0.0 to 67.2% (Additional file 10: Table S2).
The pooled prevalence was estimated to be 0.9% (95% CI: 0.6–1.2%). The included studies exhibited high heterogeneity (I2 = 97.0%, P < 0.0001; see Table 1), and the corresponding forest plot is provided in Additional file 1: Fig. S1.
The snail species that were most commonly reported to be infected with C. sinensis were Parafossarulus striatulus (pooled prevalence 1.1%, 95% CI: 0.6–1.6%), followed by Alocinma longicornis (0.9%, 95% CI: 0.3–1.7%) and Bithynia fuchslana (0.4%, 95% CI: 0.1–1.2%). Other potential vectors included P. sinensis, P. anomalospiralis, B. robust, B. misella, and Semisulcospira cancellata. When analyzed according to infection level in humans, infection rates were similar in high epidemic areas (PLADs with human prevalence ≥ 1.0%) and low epidemic areas (PLADs with human prevalence < 1.0%). The overall pooled prevalence of all snails was 0.9% (95% CI: 0.5–1.3%) in high epidemic areas, and 0.9% (95% CI: 0.4–1.4%) in low epidemic areas (see Table 1, Fig. 2).

Temporal disparities of Clonorchis sinensis infection in animal hosts according to human infection level
When stratified by year of investigation, the pooled prevalence (95% CI) of all snails changed from 0.7% (0.4–1.1%) before 1990 to 0.1% (0.0–1.9%) after 2010 (R2 = 1.5, P = 0.1421). It changed from 0.9% (0.4–1.5%) before 1990 to 0.2% (0.0–2.5%) after 2010 (R2 = 0.0, P = 0.8283) in high epidemic areas, and from 0.6% (0.2–1.2%) to 0.0% (0.0–3.6%) in low epidemic areas (R2 = 5.5, P = 0.0499). When stratified by season of investigation, infection rates among different subgroups were similar.
Infection in P. striatulus, the most common vector, was further analyzed separately. The pooled prevalence (95% CI) in P. striatulus was 1.0% (0.5–1.7%) in high epidemic areas, and 1.1% (0.6–1.8%) in low epidemic areas (see Table 1, Fig. 2). When stratified by year of investigation, the overall pooled prevalence (95% CI) in P. striatulus changed from 1.0% (0.5–1.7%) to 0.0% (0.0–1.8%; R2 = 1.5, P = 0.1421). To be specific, it changed from 1.2% (0.0–2.3%) to 0.3% (0.0–4.4%) in high epidemic areas (R2 = 0.0, P = 0.8437), and from 0.9% (0.0–1.8%) to 0.0% (0.0–2.4%) in low epidemic areas (R2 = 0.7, P = 0.3439). Similar to the results of subgroup analysis, significant decrease in prevalence over time was not revealed in the meta-regression model (see Additional file 13: Table S5). However, it needs to be cautious in explaining the results because only 4 data points were included in the analysis for period after 2010.
C. sinensis infection in the second intermediate hosts
A total of 223 articles covering 927 data points and 162,568 samples were included in the meta-analysis to estimate the pooled prevalence of C. sinensis infection in the second intermediate host.
The prevalence of C. sinensis infection in the second intermediate host varied widely, ranging from 0.0% to 100.0% (see Additional file 11: Table S3). The pooled prevalence was estimated to be 14.2% (95% CI: 12.7–15.7%), and the I2 value indicated high heterogeneity (98.6%, P < 0.0001, see Table 2; the forest plot is shown in Additional file 2: Fig. S2).
The taxonomic class of the second intermediate host explained the highest level of heterogeneity (R2 = 35.5, QM = 544.23, P < 0.0001; see Table 2). C. sinensis infections have been reported in several classes of freshwater fishes, including Cyprinidae, Cobitidae, Cichlidae, Eleotridae, and others. Among the Cyprinidae family, Pseudorasbora spp. (Cyprinidae: Gobioninae) is the most important second intermediate host of C. sinensis, with an estimated pooled prevalence of 48.5% (95% CI: 44.2–52.7%). Notably, infections in some economic fish species are also common. The pooled prevalence in Ctenopharyngodon (the most common fish used to make sashimi in south China) was estimated to be 15.2% (95% CI: 10.9–20.1%), while the estimated pooled prevalence in Cyprinus spp. (usually used to make raw fish products in northeast China) was 6.1% (95% CI: 2.9–10.2%). Besides fishes, infections in shellfish, including shrimp and crab, were also reported, with a pooled prevalence of 0.7% (95% CI: 0.0–3.3%).
When stratified by time period of investigation, pooled infection rates decreased significantly after 2010, from 18.2% (95% CI: 14.9–21.6%) before 1990 to 10.2% (95% CI: 7.8–12.8%) after 2010 (P value was 0.0002 in subgroup analysis; see Table 2). When analyzed according to infection level in humans, the pooled prevalence in all second intermediate hosts decreased significantly over time, from 20.3% (15.6–25.3%) before 1990 to 8.8% (5.6–12.6%) after 2010 in low epidemic areas (R2 = 3.5, P = 0.0002). However, such decline was not observed in high epidemic areas, with pooled prevalence of 15.3% (11.2–19.9%) before 1990 to 11.9% (8.6–15.6%) after 2010 (R2 = 0.0, P = 0.6575; see Table 2, Additional file 13: Table S5, Fig. 2).
Moreover, the season could also explain the heterogeneity significantly (R2 = 2.3, P < 0.0001; see Table 2). The infection rate was highest in spring (29.2%, 95% CI: 22.4–36.6%). However, it needs to be cautious in explaining the seasonal difference since the overwhelming majority of the studies did not record the season of investigation. Infection rates were similar in subgroups of diverse detecting methods (R2 = 0.0, P = 0.6348).
When analyzed separately, the pooled infection rates of Pseudorasbora spp. decreased from 58.2% (95% CI: 48.9–67.3%) before 1990 to 32.7% (95% CI: 22.3–44.1%) after 2010 (P = 0.0057). Similarly, the pooled prevalence in Pseudorasbora spp. decreased significantly over time in low epidemic areas, from 65.0% (54.2–75.2%) before 1990 to 23.9% (13.2–36.5%; R2 = 18.7, P < 0.0001) after 2010, while such decline was not observed in high epidemic areas, from 44.8% (29.7–60.3%) to 52.4% (32.9–71.5%; R2 = 0.0, P = 0.8666. See Table 2, Additional file 13: Table S5, Fig. 2).
C. sinensis infection in animal reservoirs
A total of 114 articles containing 239 data points and 60,817 samples of animal reservoirs were included in the meta-analysis. C. sinensis infections have been reported in cat, dog, fox, yellow weasel, hog badger, rat, pig, cattle, duck, chicken, and crocodile (see Additional file 12: Table S4). The pooled prevalence was estimated to be 14.3% (95% CI: 11.4–17.6%), and I2 value was 98.3% (P < 0.0001, see Table 3; the forest plot is shown in Additional file 3: Fig. S3). Categories of reservoir animals explained the highest level of heterogeneity (R2 = 34.9, QM = 129.81, P < 0.0001; see Table 3, Additional file 13: Table S5).
The pooled prevalence of C. sinensis was highest in cat, with a prevalence of 41.4% (95% CI: 34.0–48.9%). Infections in other animals were also common, including dog (19.5%, 95% CI: 14.9–24.6%), pig (4.6%, 95% CI: 1.9–8.1%), and rat (3.6%, 95% CI: 0.0–11.8%). These findings suggest that C. sinensis infections are not limited to a specific animal species and may be present in a variety of animals.
The overall pooled prevalence in animal reservoirs decreased over time, from 16.5% (11.4–22.4%) before 1990 to 7.1% (2.5–13.6%) after 2010 (P value was 0.0008 in multivariable meta-regression model; see Table 3, Additional file 13: Table S5). When analyzed according to infection level in humans, the pooled prevalence in animal reservoirs decreased significantly, from 18.3% (12.7–24.7%) before 1990 to 4.7% (1.0–10.4%) after 2010 in low epidemic areas (R2 = 7.4, P = 0.0024); however, such decline was not observed in high epidemic areas, with pooled prevalence (95% CI) of 11.7% (3.2–23.9%) to 20.8% (4.0–45.1%; R2 = 0.0, P = 0.4679; see Table 3, Additional file 13: Table S5, Fig. 2).
In addition, the detecting method can also partially explain the heterogeneity when analyzed separately for cats (R2 = 17.2, P = 0.0138) and dogs (R2 = 23.6, P = 0.0001). Compared with various stool examinations, necropsy examination reported a higher pooled prevalence in both cats (57.4%, 95% CI: 44.8–69.4%) and dogs (36.5%, 95% CI: 26.7–46.9%).
When analyzed separately, the pooled prevalence (95% CI) of C. sinensis infection in high epidemic areas showed a significant decrease in cats, from 49.3% (32.4–66.4%) before 1990 to 11.5% (1.6–27.8%) after 2010 (R2 = 23.0, P = 0.0163), and in dogs, from 36.9% (27.3–47.2%) to 3.5% (0.4–9.1%) (R2 = 43.1, P < 0.0001). However, such decline was not observed in low epidemic areas, with the pooled prevalence remaining relatively stable in cats, from 52.6% (20.2–83.9%) before 1990 to 50.8% (19.3–81.8%) after 2010 (R2 = 0.0, P = 0.9964), and in dogs, from 22.6% (10.0–38.3%) to 17.3% (1.3–43.4%) (R2 = 16.1, P = 0.0854; see Table 3, Additional file 13: Table S5, Fig. 2). Moreover, the results of multivariable meta-regression model further verified the spatial–temporal disparities both in cats and in dogs (Additional file 13: Table S5).
Publication bias and sensitivity analysis
The presence of publication bias was detected through funnel plots, and the result of Egger’s test revealed the potential existence of publication bias (see Additional file 4: Fig. S4a, Additional file 5: Fig. S4b, Additional file 6: Fig. S4c). However, sensitivity analysis demonstrated that the pooled prevalence did not change significantly when excluding outliers, removing data with small sample sizes, or excluding studies without reporting the detecting method to measure C. sinensis infection (i.e., studies with moderate or high risk of bias). The 95% CI remained overlapping, indicating the robustness of the main results (see Additional file 14: Table S6). Additionally, similar temporal disparities were also observed in both low and high epidemic areas. This suggests that the temporal trends in C. sinensis infection rates remained consistent even after accounting for the quality of publications (see Additional file 15: Table S7).
Spatio-temporal distribution and biogeographical characteristics of C. sinensis infection in animal hosts
A total of 114 survey sites of first intermediate hosts, 223 s intermediate hosts, and 123 animal reservoirs were geographically referenced and plotted on the epidemic map of China. Infections of C. sinensis in animal hosts in China were predominantly reported in areas east of the Heihe-Tengchong Line (Hu Line) [36], which roughly corresponds to the 400 mm precipitation line of China (see Fig. 3). For the first intermediate hosts, Parafossarulus spp. infections were reported widely, while Alocinma spp. and Bithynia spp. infections were mainly reported in the south areas (Fig. 3a); for the second intermediate hosts, infections in fishes of Cyprinidae, especially Gobioninae, were reported most widely (Fig. 3b); while for animal reservoirs, infections in cats and dogs were widely distributed (Fig. 3c). Interestingly, the infection rates in animal hosts were not consistent with the epidemic levels of human C. sinensis infection. For instance, high infection rates in snails, second intermediate hosts, or animal reservoirs were frequently reported in low-endemic PLADs of China (see Fig. 3).
Distribution and prevalence of Clonorchis sinensis infection in diverse animal hosts in China. a C. sinensis in snails; b C. sinensis in second intermediate hosts; c C. sinensis in animal reservoirs. The diagonal lines in all maps are the Heihe-Tengchong Line (Hu Line)
To explore the biogeographical characteristics of C. sinensis infection in animals, we used scatter plots to display the environmental dimensions. The results, depicted in Fig. 4 and summarized in Table 4, indicate that animals with C. sinensis infection are predominantly reported in areas with specific environmental conditions. These conditions include an annual mean temperature above − 0.24 °C, a mean temperature of the warmest quarter above 16.21 °C, an annual precipitation above 345 mm, a precipitation of the warmest quarter above 189 mm, and an altitude below 2346 m.

Environmental characteristics of regions reporting animal Clonorchis sinensis infections in China