
Congenital disorders
Triglyceride-glucose index is associated with severe obstructive coronary artery disease and atherosclerotic target lesion failure among young adults
Oct
Baseline characteristics of study participants
The mean age of the study population was 39.3 ± 4.4 years, and 2146 (70.9%) of them were male. Baseline demographics, cardiovascular risk factors, and clinical characteristics were compared between young cases and controls in Table 1. Compared to young controls, EOCAD cases were more likely to be male, overweight, or obese, smokers and drinkers, and a patient with hypertension, DM, dyslipidemia, and CKD (p < 0.05). Restricting subjects to male participants (Additional file 1: Table S1) or to participants from Zhongshan Hospital, Fudan University (Additional file 1: Table S2) did not meaningfully change the differences in baseline characteristics between cases and controls.
Association of TyG index with EOCAD susceptibility
EOCAD cases presented a significantly higher level of the TyG index than young controls (mean ± SD, 9.2 ± 0.8 in cases vs. 8.7 ± 0.7 in controls, p < 0.001). After adjusting for age, sex, current smoking, drinking, hypertension, DM, and dyslipidemia, the TyG index was positively associated with the prevalence of EOCAD (odds ratios [OR]: 1.40, 95% confidence interval [CI] 1.23–1.60, p < 0.001, per SD increase in the TyG index). This corresponded to a twofold increased prevalence of EOCAD among participants in TyG index tertile 3 as compared to tertile 1 (OR: 2.00, 95% CI 1.48–2.71, p < 0.001) (Table 2). Among EOCAD patients, TyG index was significantly and positively correlated with BMI, SBP, DBP, TC, non-high-density lipoprotein-cholesterol (non-HDL-C), and HbA1c, but negatively correlated with HDL-C (all p < 0.001, Additional file 1: Table S3). The independent association observed between the TyG index and the likelihood of EOCAD did not alter when restricting participants to males (Additional file 1: Table S4).
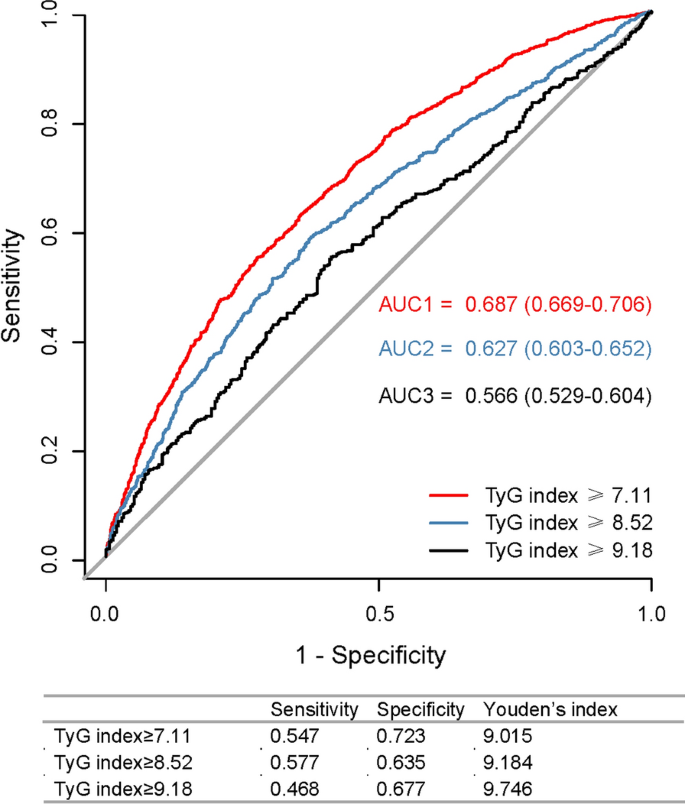
Diagnostic performance of TyG index for EOCAD susceptibility
The ROC for the occurrence of EOCAD had the largest AUC of 0.687 (95% CI 0.669–0.706, p < 0.001) when the rule-in threshold of TyG index was 7.11, and had an AUC of 0.627 (95% CI 0.603–0.652, p < 0.001) and 0.566 (95% CI 0.529–0.604, p < 0.001) when the rule-in threshold of TyG index was 8.52 and 9.18, respectively (Fig. 1). The critical value of the TyG index to estimate EOCAD risk was 9.015 (sensitivity: 54.7%; specificity: 72.3%). Although there was no increment in AUC (from 0.897 to 0.889, p = 0.77), the addition of the TyG index to the established risk estimation model that included age, BMI, sex, current smoking, drinking, hypertension, DM, high levels of uric acid and non-HDL-c, and decreased levels of HDL-c, provided an improvement of diagnostic ability for EOCAD, with a continuous NRI of 0.1018 (95% CI 0.0307–0.1728, p = 0.005). This suggested an improved predictive power by the addition of the TyG index, which correctly reclassified EOCAD cases by 10.18%. IDI analysis did not show statistically significant improvement in reclassification (IDI: 0.0001, 95% CI − 0.0004–0.0013, p = 0.27). The sensitivity analysis in men showed the largest AUC of 0.621 (95% CI 0.594–0.674; p < 0.001) when the rule-in threshold of TyG index was 0.733, and the critical value was 9.183 (sensitivity: 50.0%; specificity: 70.3%) (Additional file 1: Fig S1).
ROC analysis of TyG index at hospitalization by various rule-in thresholds to identify EOCAD among young adults. ROC receiver operating characteristic curve, TyG index triglyceride-glucose index, EOCAD early-onset coronary artery disease, AUC area under the curve
TyG-index and incident TLFs
Baseline characteristics of 1302 post-PCI patients were listed by tertiles of TyG index (Table 3). The most prominent differences were that patients in the highest tertile group were more likely to be male, obese, smokers or alcohol drinkers, tended to have hypertension, DM, and lipid disorders, showed higher heart rate, higher SBP, and DBP, and had worse lipid and glucose profile as compared to those in the lower tertile groups of TyG index. There were no significant differences across tertile groups of TyG index in the clinical presentation, left main/left anterior descending artery involvement, Gensini score, left ventricular ejection fraction (LVEF), and the course of PCI. Those in the highest tertile group of TyG index were more likely to have multivessel disease. The secondary prophylactic medications differed, with the lowest prescription rates occurring in the lowest TyG index tertile group. Additionally, the TyG index had no significant correlation with the Gensini score or LVEF (Additional file 1: Table S3).
During a median of 33 month (IQR: 31–34 months) follow-up, 43 (3.3%) cases had the events of TLF after successful PCI. The median follow-up time across tertile groups of TyG index was comparable (Table 3). The incidence of TLF was increased across tertiles of TyG index (p for trend < 0.001, Table 3). Univariate Cox proportional analysis was presented in Additional file 1: Table S5. Only Gensini score and diagnoses of non-AMI on admission had univariate associations with the outcome (p < 0.05). In the fully adjusted model, the risk of TLF was increased by 30% (adjusted HR: 1.30; 95% CI 1.01–1.73, p = 0.04), per SD increase in the TyG index. Using subjects in the lowest tertile group as control, the fully adjusted HR for TLF was 2.41 (95% CI 0.93–4.60, p = 0.08) in the middle and 2.41 (95% CI 1.07–5.42, p = 0.03) in the highest tertile group of TyG index (Table 4). The association between the TyG index and TLF was consistent across participants with different categories of BMI, statuses of DM, diagnoses on admission, numbers of diseased vessels, tertiles of Gensini score, and PCI strategies in multivariate analysis (all p for interaction ≥ 0.05) (Fig. 2).

Stratification analysis of the association between TyG index and TLF in different subgroups of patients with EOCAD. TyG triglyceride-glucose, TLF target lesion failure, EOCAD early onset coronary artery disease, BMI body mass index, AMI acute myocardial infarction, LM left main artery, PCI percutaneous coronary intervention, DES drug-eluting stent, DEB drug-eluting balloon, PTCA percutaneous transluminal coronary angioplasty, HR hazard ratio, CI confidential intervals
Prognostic ability of the TyG index for TLF
The ROC curve for the outcome of TLF showed an AUC of 0.722 (0.649–0.794) when the baseline risk variables, including age, sex, BMI, current smoking, drinking, hypertension, DM, CKD, previous MI, Gensini score, diagnosis, and types of PCI were used alone. The addition of the TyG index to the clinical model provided a considerable increment of AUC to 0.734 (0.658–0.811; likelihood ratio test. p = 0.04) (Fig. 3). In addition, the continuous NRI for TLF was 0.132(− 0.065–0.256, p = 0.19) and the IDI was 0.004 (− 0.002–0.027, p = 0.16), indicating improvement in TLF risk discrimination, although both did not reach the statistical significance.

ROC analysis of the predictive value of TyG index for TLF among patients with EOCAD. ROC receiver operating characteristic curve, TyG index triglyceride-glucose index, TLF target lesion failure, EOCAD early-onset coronary artery disease, AUC area under the curve