Infection
COVID map shows states where positive cases are higher
States in the Central, Northern and Pacific regions remain among the ones with the highest number of COVID-19 infections in the country despite a general drop at a national level, according to the latest data produced by the Centers for Disease Control and Prevention (CDC).
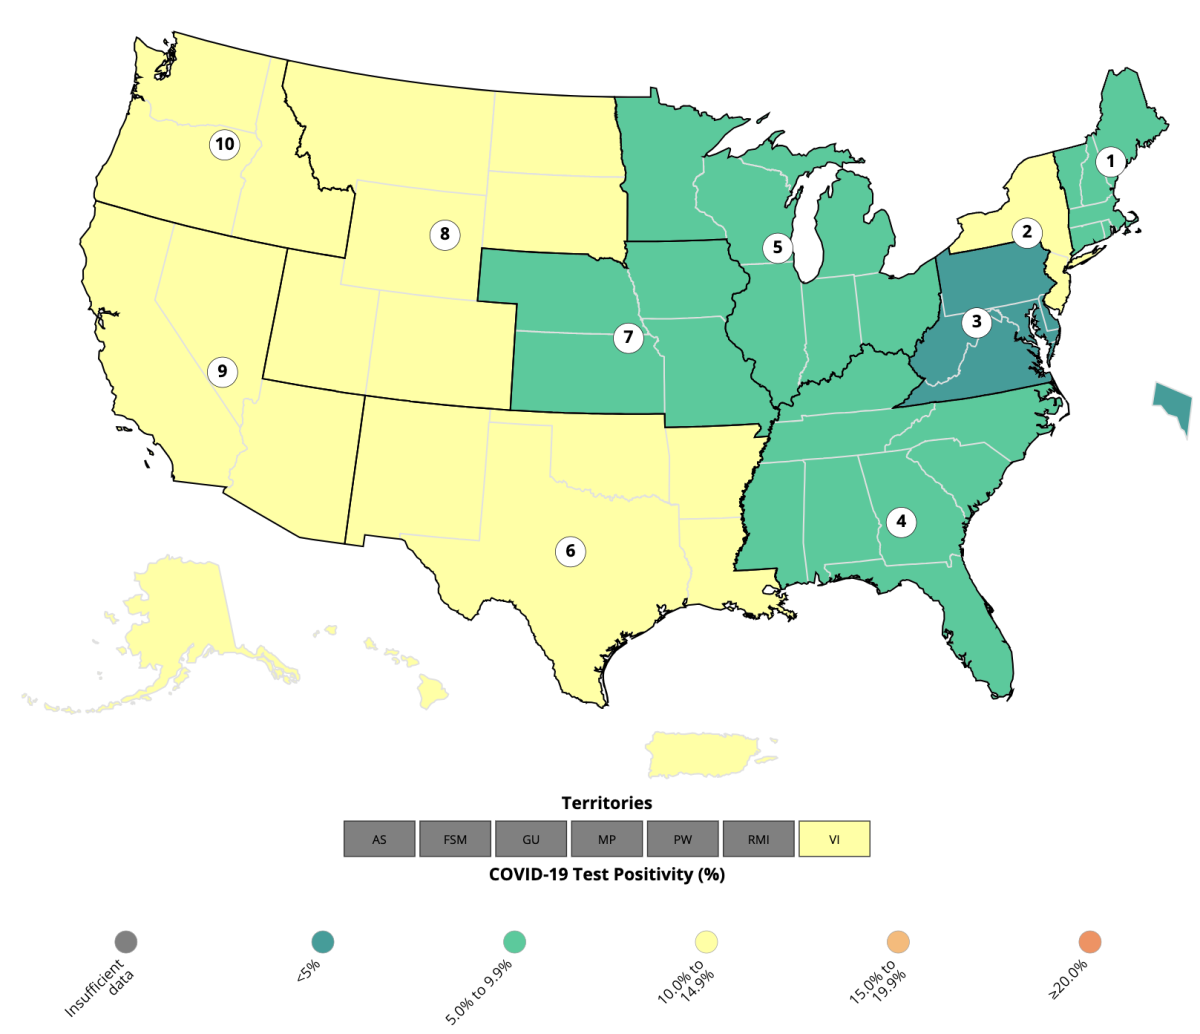
Every week, the CDC produces a map tracking the virus positivity—the number of COVID-19 tests which return positive, one of the most reliable indicators of the impact of the disease in the community.
During the week ending on October 14, the latest data made available by the CDC, the number of COVID-19 infections across the country was on average 9.5 percent—a 0.7 percent drop compared to the previous week.
The positivity rate at a national level has been sliding down for weeks now, suggesting that infections are stabilizing. But the CDC experts warned that cases could pick up again over the winter, especially as other seasonal illnesses like the cold and the flu are expected to hit the general population and weaken their immune system.
CDC
While cases have dropped in states in New England, which at the beginning of the month still had a positivity rate above 10 percent, other states are seeing infections climb.
Two weeks ago, the positivity rate in Colorado, Montana, North Dakota, South Dakota, Utah and Wyoming was 13.8 percent, 0.6 percent lower than it was in the week ending on October 14. They’re now the most affected states in the country, at 14.4 percent.
Alaska, Idaho, Oregon and Washington followed with a positivity rate of 11 percent, while Arizona, California, Hawaii, Nevada, Arkansas, Louisiana, New Mexico, Oklahoma and Texas had a rate of 10.5 percent.
The other states in the country to have a positivity rate above 10 percent were New Jersey and New York, with 10.1 percent. The week before these two states were still the second-most affected in the country with an 11.9 percent positivity rate.
Even more positively, the CDC now reports a number of states with a positivity rate below 5 percent—data which did not appear on the map for weeks, if not months. These states were Delaware, District of Columbia, Maryland, Pennsylvania and Virginia, with a rate of 4.8 percent.
Newsweek contacted the CDC for comment by email on Monday, October 23.
Amid a rise of COVID-19 infections by the end of summer—in the U.S. as well as in Europe, the Middle East and Asia—the CDC has recommended all Americans keep up with COVID-19 vaccines and booster shots in order to prevent a significant spread of the illness this fall and winter.
In September, the World Health Organization (WHO) also called for people to keep up with their vaccinations and for officials to keep monitoring the spread of the disease, denouncing a lack of checks.
Uncommon Knowledge
Newsweek is committed to challenging conventional wisdom and finding connections in the search for common ground.
Newsweek is committed to challenging conventional wisdom and finding connections in the search for common ground.

