
Cardiovascular
Predictive value of the stress hyperglycemia ratio in dialysis patients with acute coronary syndrome: insights from a multi-center observational study
Oct
Study design and population
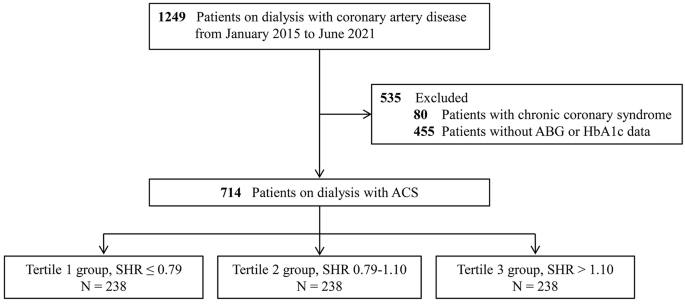
The present study employed data obtained from the CRUISE-R (Coronary Revascularization in Patients On Dialysis in China-Retrospective) cohort study (ClinicalTrials.gov NCT05841082). The CRUISE-R study sought to undertake a comprehensive, observational, and multi-center registry investigation in China, targeting dialysis patients who were afflicted with coronary artery disease. The study’s principal objectives were to scrutinize the clinical features, therapeutic approaches, and prognosis of this particular patient population. A standardized protocol for patient selection was established with specific criteria and procedures, ensuring a uniform approach across all participating centers. The necessary information for screening criteria was easily available in electronic health records. All investigators involved in patient recruitment received unified training on the standardized screening criteria to reduce inter-center variability. Timely meetings and communication channels were established to address questions or concerns. Between January 2015 and June 2021, a total of 455,617 cardiac catheterizations were retrospectively evaluated in 30 tertiary medical centers, which were distributed across 12 provinces in China (Additional file 1: eAppendix 1). Exclusion criteria were rigorously applied, including patients who did not receive dialysis therapy or received dialysis therapy for less than 3 months (n = 453,421), those without any coronary stenosis exceeding 50% (n = 328), and individuals with other indications for coronary angiography (such as surgical interventions, valve diseases, or kidney transplants) (n = 87). For readmitted patients, only data from their initial admission were analyzed, with subsequent readmissions documented as “readmission” events (n = 532). Overall, the CRUISE-R study enlisted 1,249 dialysis patients suffering from obstructive coronary artery disease. The CRUISE-R registry study was carried out following the Declaration of Helsinki and was approved by local institutional review boards, with a waiver of informed consent. In the present analysis, we additionally eliminated 80 individuals with a diagnosis of stable angina and 455 patients with incomplete data on ABG or HbA1c. (Fig. 1) This study adhered to the Strengthening the Reporting of Observational Studies in Epidemiology (STROBE) statement.
Study Flowchart. ABG = admission blood glucose; ACS = acute coronary syndrome; SHR = stress hyperglycemia ratio
Data collection and definitions
The data were obtained from electronic medical records at each participating center by qualified study coordinators. The data set included patient demographics, comorbid conditions, cardiac history, cardiac function, location, and severity of coronary artery disease, procedure information, medical treatment, and clinical events. Key variables, including diagnosis, dialysis details, coronary severity, medical treatment, and clinical events, were inputted using double-entry by two trained researchers, with a third researcher verifying inconsistent data, while other variables underwent random audits. These validations ensured data accuracy and adherence to the screening criteria. A diagnosis of diabetes was deemed applicable when the individual had previously been diagnosed with the condition, was currently or previously using oral hypoglycemic drugs or insulin, or possessed HbA1c levels ≥ 6.5% at admission [21]. The definition of hypertension was based on the following criteria: systolic blood pressure ≥ 140 mmHg, diastolic blood pressure ≥ 90 mmHg, or the utilization of antihypertensive treatment [22]. The ABG was defined as the initial random serum glucose measurement taken within 24 h of hospital admission. Blood samples for HbA1c testing were also collected within 24 h of admission. The SHR was determined by dividing the glucose levels upon admission by the estimated average chronic glycemic value. The estimated average chronic glycemic level was obtained through the following equation: estimated average glucose (mmol/L) = 1.59 × HbA1c (%) − 2.59 [23]. In accordance with this, the formula for calculating the SHR was as follows: SHR = ABG/ [1.59 × HbA1c (%) − 2.59] [15]. The readily available hospital admission records furnished the necessary information to derive the GRACE risk scores, which run on a scale of 1 to 372 [6]. With higher GRACE scores indicating more precarious outcomes, the variables which were considered include age, heart rate, systolic blood pressure readings, creatinine levels, Killip classification, cardiac arrest during admission, the presence of ST-segment deviation, as well as cardiac biomarker levels.
Outcomes
The primary outcome was major adverse cardiovascular events (MACE), as defined by a composite of all-cause death, non-fatal myocardial infarction, and non-fatal stroke. Myocardial infarction was confirmed through the presence of ischemic symptoms, elevated levels of serum cardiac biomarkers, and/or distinct ECG changes in patients. Stroke was confirmed as a new neurological deficit attributed to a vascular cause in the central nervous system, supported by imaging evidence from computed tomography or magnetic resonance imaging. Secondary outcomes were all-cause mortality and cardiovascular mortality. Cardiovascular mortality was defined as death due to acute myocardial infarction, heart failure, sudden cardiac death, stroke, cardiovascular procedure, or cardiovascular hemorrhage. Survival and clinical assessment data were gathered by trained nurses via outpatient clinic visits and telephone interviews. The follow-up period lasted until 30th June 2022 and was augmented by data extracted from the medical records of patients who were readmitted. Patients who were unavailable for telephone interviews were censored, and their survival status was fixed at the latest validated point in time, such as the date of the last outpatient clinic visit, or the final day of any hospital admission. Multiple occurrences of events were only evaluated once, with only the primary event included in the statistical analyses.
Statistical analysis
Patients were stratified into three groups based on the SHR tertiles. Continuous variables are given as mean (standard deviation) or as the median and interquartile range (25th to 75th percentile) and analyzed with the ANOVA test or the Kruskal-Wallis H test as appropriate. Categorical variables are presented as frequency (percentages) and analyzed with the chi-square test or the Fisher exact test where appropriate.
The cumulative incidence of clinical outcomes was ascertained via the application of the Kaplan-Meier method and was compared with the log-rank test. The association between the SHR and primary and secondary outcomes was assessed with univariable and multivariable Cox proportional hazard models. For each outcome and exposure (SHR as either a continuous variable or tertiles), three models were implemented. Model 1 was an unadjusted analysis. Model 2 was adjusted for age and gender. Additionally, a completely adjusted Model 3 was analyzed, which was further adjusted for candidate variables listed in Table 1. Confounders that were significant in the univariate model, or of clinical importance, were included in Model 3. Results were reported as the hazard ratio (HR) and a 95% confidence interval (CI). The Schoenfeld residuals were used to ensure the proportional hazards assumption was met. Moreover, we conducted restricted cubic spline (RCS) analyses with five knots, placed at the 5th, 27.5th, 50th, 72.5th, and 95th centiles, to investigate potential nonlinear relationships between SHR and outcomes. Additionally, the RCS model was also adjusted for confounding factors included in Model 3. Incremental predictive performance after introducing ABG or SHR to the GRACE score was evaluated by calculating the C statistic, continuous net reclassification improvement (NRI), and integrated discrimination improvement (IDI) [24, 25]. Subgroup analyses were conducted based on diabetes status, with further analyses to assess the association between SHR and improvements in GRACE risk score predictive efficiency.
Furthermore, in individuals with low admission hemoglobin values, there exists a potential for an underestimation of the average chronic glucose level calculated from HbA1c. Thus, a sensitivity analysis was conducted to assess the robustness of the main results by excluding patients with admission hemoglobin < 100 g/L. All P values were two-sided, and statistical significance was considered at a value of < 0.05. The data were analyzed using SPSS 23.0 (IBM SPSS 23 Inc) and R 3.6.1 (R Development Core Team, Vienna, Austria).