
Cardiovascular
Association of triglyceride glucose index with all-cause and cardiovascular mortality in the general population
Nov
Characteristics of the population stratified by triglyceride glucose index
As presented in Table 1, baseline patient characteristics were stratified by TyG index quartiles (Q): Q1: < 8.148; Q2: 8.148–8.569; Q3: 8.570–9.019; Q4: ≥ 9.020. The mean TyG index levels in these quartiles were 7.811 ± 0.271, 8.365 ± 0.122, 8.783 ± 0.130, and 9.499 ± 0.471, respectively. In comparison with patients with lower TyG index values, those in the higher TyG index group tended to be male, older, smokers, have lower educational levels, use lipid-lowering agents and hypoglycemic agents, and exhibit a higher prevalence of comorbidities, including heart failure, coronary artery disease, diabetes, hypertension, and stroke. Moreover, the higher TyG index group was associated with higher BMI, SBP, DBP, HOMA-IR, and blood indicators, including ALT, AST, creatinine, TC, TG, uric acid, fasting glucose, glycosylated hemoglobin, insulin, white blood cell count, red blood cell count, and platelet count. With increasing TyG index, both all-cause mortality (6.652% vs. 12.222% vs. 15.417% vs. 19.089%, P < 0.001) and heart disease-specific mortality (1.425% vs. 3.095% vs. 3.859% vs. 5.168%, P < 0.001) exhibited a gradual increase.
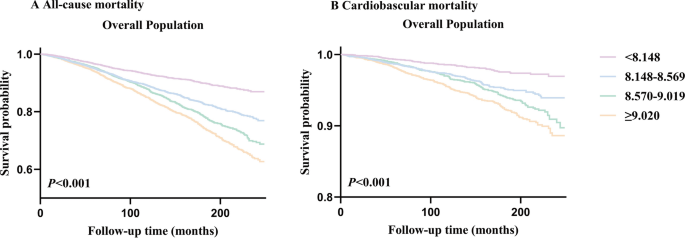
Kaplan–Meier survival analysis curves for all-cause and cardiovascular mortality according to triglyceride glucose index
During 2,441,212 person-months of follow-up (median follow-up of 105 months), there were 2,695 incident cases of all-cause mortality and 684 incident cases of cardiovascular mortality. The mortality across TyG index groups is illustrated in Fig. 2. A significant difference in mortality was observed among these groups (All-cause mortality: P for log-rank test < 0.001; cardiovascular mortality: P for log-rank test < 0.001) in the overall population (Fig. 2A, B).
Kaplan–Meier survival analysis curves for all-cause and cardiovascular mortality. TyG index quartile (Q): Q1: < 8.148; Q2:8.148–8.569; Q3:8.570–9.019; Q4: ≥ 9.020. A Kaplan–Meier analysis for mortality among TyG index groups in A all-cause mortality, B cardiovascular mortality
Associations of triglyceride glucose index with all-cause mortality and cardiovascular mortality
Cox proportional hazard analysis revealed a significant association between the TyG index and both all-cause and cardiovascular mortality in the crude model [All-cause mortality: HR (95% CI) 1.561 (1.485, 1.640), P < 0.001; cardiovascular mortality: HR (95% CI) 1.669 (1.516, 1.838), P < 0.001] and the adjusted models [Adjusted I: All-cause mortality: HR (95% CI) 1.168 (1.098, 1.244), P < 0.001; cardiovascular mortality: HR (95% CI) 1.319 (1.168, 1.490), P < 0.001; Adjusted II: all-cause mortality: HR (95% CI) 1.160 (1.062, 1.267), P < 0.001; cardiovascular mortality: HR (95% CI) 1.213 (1.020, 1.441), P = 0.029] when the TyG index was considered a continuous variable (Table 2).
In the crude and Adjust I models, there were upward trends between the TyG index and both all-cause and cardiovascular mortality (Table 2, both P for trend < 0.05). However, these results were not consistently observed in multivariate Cox proportional hazard analysis of the TyG index and all-cause and cardiovascular mortality in Model II (Table 2, all-cause mortality: P for trend = 0.424; cardiovascular mortality: P for trend = 0.481).
Given that multivariate Cox proportional hazard analysis suggested a non-linear relationship between the baseline TyG index and both all-cause and cardiovascular mortality, restricted cubic splines analysis was employed to further investigate this association. The adjusted restricted cubic spline plots displayed non-linear associations between TyG index and both all-cause (Fig. 3A, Non-linear P = 0.003) and cardiovascular mortality (Fig. 3B, Non-linear P = 0.034).

Association between TyG index and all-cause and cardiovascular mortality in the general population. A all-cause mortality, B cardiovascular mortality. Each hazard ratio was computed with a TyG index level of A 8.757 and B 8.975 as the reference. Adjusted for age, gender, race, BMI, SBP, DBP, TC, uric acid, DM, education, smoking, lipid-lowering agents and hypoglycemic agent. TyG Index triglyceride glucose index, BMI body mass index, DBP diastolic pressure, SBP systolic pressure, TC cholesterol, DM diabetes mellitus, HR Hazard Ratio
Subgroup analysis of the association between TyG index and all-cause and cardiovascular mortality
To assess the impact of the TyG index on the primary endpoints, stratification was conducted according to age, gender, body mass index, smoking, education, HbA1c, uric acid, hypertension, heart failure, stroke, and coronary artery disease (Figs. 4, 5). Except for the age subgroup (age subgroup: all-cause mortality: P for interaction < 0.001, cardiovascular mortality: P for interaction < 0.001), there was no significant interaction in most subgroups (other subgroups: all-cause mortality: P for interaction = 0.077–0.940, cardiovascular mortality: P for interaction = 0.173–0.987). The TyG index was closely related to all-cause and cardiovascular mortality in patients aged < 65 (all-cause mortality: HR (95% CI) 1.612 (1.426, 1.823), P < 0.001; cardiovascular mortality: HR (95% CI) 1.998 (1.586, 2.517), P < 0.001), but not in patients aged ≥ 65 (All-cause mortality: HR (95% CI) 0.986 (0.890, 1.093), P = 0.790; cardiovascular mortality: HR (95% CI) 0.914 (0.747, 1.118), P = 0.382).

Subgroup analysis of the association between TyG index and all-cause mortality. Adjusted for age, gender, race, BMI, SBP, DBP, TC, uric acid, DM, education, smoking, lipid-lowering agents and hypoglycemic agent, except the subgroup factors themselves. TyG Index triglyceride glucose index, BMI body mass index, DBP diastolic pressure, SBP systolic pressure, TC cholesterol, DM diabetes mellitus, HR Hazard Ratio

Subgroup analysis of the association between TyG index and cardiovascular mortality. Adjusted for age, gender, race, BMI, SBP, DBP, TC, uric acid, DM, education, smoking, lipid-lowering agents and hypoglycemic agent, except the subgroup factors themselves. TyG Index triglyceride glucose index, BMI body mass index, DBP diastolic pressure, SBP systolic pressure, TC cholesterol, DM diabetes mellitus, HR Hazard Ratio
Kaplan–Meier survival analysis curves for all-cause and cardiovascular mortality according to triglyceride glucose index and stratified by age
We grouped the study population based on age (< 65, ≥ 65) and divided these two groups into four quartiles to generate survival curves. Interestingly, age-stratified survival curves demonstrated that significant differences in mortality rates among groups persisted in the population aged < 65 (All-cause mortality: P for log-rank test < 0.001; cardiovascular mortality: P for log-rank test < 0.001, Fig. 6A, B). However, the differences in mortality among patients aged ≥ 65 did not reach statistical significance (All-cause mortality: P for log-rank test = 0.061; cardiovascular mortality: P for log-rank test = 0.059, Fig. 6C, D).

Kaplan–Meier survival analysis curves for all-cause and cardiovascular mortality after stratification by age. A Kaplan–Meier analysis for all-cause mortality among TyG index groups in A < 65 years old, C ≥ 65 years old. A Kaplan–Meier analysis for cardiovascular mortality among TyG index groups in B < 65 years old, D ≥ 65 years old
Further, the study population was grouped according to age (< 25, 25–44, 45–64, 65–85), and survival curves were plotted based on their respective quartiles. Significant differences in mortality among groups persisted in the population aged 25–44 and 45–64 (both P for log-rank test < 0.05) (Additional file 1: Figure S1A, B, C, D), but not in the population aged < 25 (All-cause mortality: P for log-rank test = 0.871, cardiovascular mortality: P for log-rank test = 0.472, Additional file 1: Figure S1E, F) and 65–85 (survival analysis curves of the population aged over 65 in Fig. 6C, D).
Associations of triglyceride glucose index with all-cause and cardiovascular mortality after stratification by age
Based on Figs. 4 and 5, the association of the TyG index with all-cause and cardiovascular mortality was further explored in different age groups. The study population was stratified into two groups based on their age (< 65 vs. ≥ 65). The results showed that TyG index levels were associated with mortality only in the < 65 age group [all-cause mortality: 1.382 (1.214, 1.575), P-interaction < 0.001; cardiovascular mortality: 1.772 (1.388, 2.262), P-interaction < 0.001]. Furthermore, the study population was grouped into four groups according to age (< 25, 25–44, 45–64, 65–85). TyG index levels were associated with mortality only in the 45–64 age group (all-cause mortality: 1.405 (1.221, 1.617), P-interaction = 0.005; cardiovascular mortality: 1.816 (1.402, 2.352), P-interaction = 0.002) (Table 3).
There was a linear relationship (Non-linear P = 0.742, Fig. 7A) and upward trends (P for trend = 0.010, Table 4) between the TyG index and cardiovascular mortality in the < 65 age group. Similar results were also observed in the population aged 45–64 (Non-linear P = 0.902, Fig. 8A; P for trend = 0.015, Table 4). However, the association of the TyG index with all-cause mortality exhibited a non-linear pattern in the < 65 and 45–65 age groups (< 65: Non-linear P = 0.011, Fig. 7B; 45–64: Non-linear P = 0.001, Fig. 8B).

Association between TyG index and all-cause and cardiovascular mortality in aged < 65. A all-cause mortality, B cardiovascular mortality. Each hazard ratio was computed with a TyG index level of A 8.889 and B 8.781 as the reference. Adjusted for age, gender, race, BMI, SBP, DBP, TC, uric acid, DM, education, smoking, lipid-lowering agents and hypoglycemic agent. TyG Index triglyceride glucose index, BMI body mass index, DBP diastolic pressure, SBP systolic pressure, TC cholesterol, DM diabetes mellitus, HR Hazard Ratio

Association between TyG index and all-cause and cardiovascular mortality in aged 45–64. A all-cause mortality, B cardiovascular mortality. Each hazard ratio was computed with a TyG index level of A 9.008 and B 8.701 as the reference. Adjusted for age, gender, race, BMI, SBP, DBP, TC, uric acid, DM, education, smoking, lipid-lowering agents and hypoglycemic agent. TyG Index triglyceride glucose index, BMI body mass index, DBP diastolic pressure, SBP systolic pressure, TC cholesterol, DM diabetes mellitus, HR Hazard Ratio
ROC curve analysis of TyG index and HOMA-IR
The ROC curve for the TyG index and HOMA-IR in predicting primary endpoints is depicted in Fig. 9. As expected, the TyG index outperformed HOMA-IR in predicting all-cause mortality (0.620 vs. 0.524, P < 0.001). Similar results were also observed in predicting cardiovascular mortality (0.623 vs. 0.537, P < 0.001).

ROC Curve analysis for TyG index and HOMA-IR Predicted All-cause and Heart disease-specific mortality. A All-cause mortality; B Cardiovascular mortality. TyG index triglyceride glucose index, AUC area under curve, ROC receiver operating characteristic, HOMA-IR homeostasis model assessment of insulin resistance
The cut-off values for the TyG index to predict all-cause and cardiovascular mortality were 8.401 and 8.289, respectively. The sensitivity was 0.757 and 0.848, while the specificity was 0.420 and 0.335, respectively.