
Cancer and neoplasms
Lifetime probability of developing cancer and dying from cancer in Canada, 1997 to 2020
Sep
Abstract
Background
The lifetime probabilities of developing (LPdev) cancer and dying (LPdying) from cancer are useful summary statistics that describe the impact of cancer within a population. This study aims to present detailed LPdev and LPdying for cancer by sex and cancer type and to describe changes in these lifetime probabilities over time among the Canadian population.
Data and methods
Cancer incidence data (1997 to 2018) were obtained from the Canadian Cancer Registry. All-cause and cancer mortality data (1997 to 2020) were obtained from the Canadian Vital Statistics – Death Database. LPdev and LPdying were calculated using the DevCan software, and trends over time were estimated using Joinpoint.
Results
The LPdev for all cancers combined was 44.3% in Canada in 2018, with all results excluding Quebec. At the age of 60, the conditional probability of developing cancer was very similar (44.0% for males and 38.2% for females). The LPdying was 22.5% among the Canadian population in 2020, while the probability of dying from cancer conditional on surviving until age 60 was 25.1% for males and 20.5% for females. Generally, males experienced higher LPdev and LPdying for most specific cancers compared with females.
Interpretation
LPdev and LPdying for cancer mirror cancer incidence and mortality rates. Cancer-specific changes in these probabilities over time are indicative of the cancer trends resulting from cancer prevention, screening, detection, and treatment. These changes in LPdev and LPdying provide insight into the shifting landscape of the Canadian cancer burden.
Keywords
Neoplasms, cancer registry, lifetime probability, surveillance, epidemiology
Authors
JiaQi L. Liu, Shary Xinyu Zhang and Jean-Michel Billette are with the Centre for Population Health Data at Statistics Canada. Alain A. Demers is with the Centre for Surveillance and Applied Research at the Public Health Agency of Canada.
Introduction
Cancer is a leading cause of morbidity and mortality worldwide.Note 1 Its incidence is driven by numerous factors, including tobacco use, physical inactivity, excess body weight and population aging.Note 1, Note 2 Technological advances in oncological treatments have continued to improve the survival of Canadians diagnosed with malignancies. As better treatments are made available and patients survive longer, the burden of an increasing population living with malignancies will result in significant rising health care costs.Note 3
In 2022, 233,900 new cases of cancer were expected to be diagnosed, and 85,100 Canadians were expected to die from cancer.Note 4 The lifetime probability of developing cancer (LPdev) and the lifetime probability of dying from cancer (LPdying) are statistics used to help understand the cancer experience of a population and should not be used to make predictions at the individual level.Note 5 According to recent Canadian estimates, over two in five Canadians will likely develop cancer in their lifetime, and one in four is expected to die of it.Note 6 However, there is little information on how LPdev and LPdying have changed over time. These probabilities are based on annual incidence and mortality rates and vary with these rates. This article aims to present temporal changes in the LPdev and LPdying in the Canadian population.
Methods
Data sources
The Canadian Cancer Registry (CCR) is a dynamic, person-oriented, and population-based database that includes primary cancer cases and in situ bladder tumour cases collected from Provincial/Territorial Cancer Registries from 1992 to the most current diagnosis year available (2018 for Canada excluding Quebec at the time of the study). The multiple primary coding rules of the International Agency for Research on CancerNote 7 were applied. Cases were defined based on the International Classification of Diseases for Oncology, Third Edition, and classified using the Surveillance, Epidemiology, and End Results Program grouping definitions.Note 8, Note 9
The Canadian Vital Statistics – Death Database (CVSD) is a yearly census of all deaths occurring in Canada reported by the provincial and territorial vital statistics registrars to Statistics Canada. The underlying cause of death information, coded using the International Classification of Diseases, 9th revision (ICD‑9) before 2000 and 10th revision (ICD-10) from 2000 onward, was used to derive cancer mortality from 1997 to the most current death year available (2020 at the time of this study). Yukon deaths were imputed for the 2017-to-2020 period since death records from Yukon were last reported to CVSD in 2016.
Data analysis
Crude probabilities of developing cancer or dying from cancer were calculated using the DevCan software from the National Cancer Institute.Note 10 DevCan uses cross-sectional data on cancer diagnoses, cancer deaths, all deaths and population estimates to compute (1) the age-specific probability of developing cancer conditional on surviving and remaining cancer-free until a given age, and (2) the age-specific probability of dying from cancer conditional on surviving until a given age. These estimates are based on a life table approach with five-year age groups applied to a hypothetical cohort of 10,000,000 live births using a competing-risks framework.
Age-specific incidence and mortality rates are assumed to be constant in each age group. Lifetime probabilities are computed as the probability of remaining cancer-free and alive (LPdev) or just alive (LPdying) at the beginning of an age interval multiplied by the probability of developing cancer or dying from cancer during that age interval, summed over all age intervals. Similarly, age-conditional probabilities assume conditional survival up to a specified age and are summed across subsequent age intervals up to the terminal age group.
Trend analyses were carried out using the Joinpoint Regression Program,Note 11 which calculates the annual percentage change in the logarithm of LPdev and LPdying between data points. The early years of the CCR were not considered since it was not possible to validate whether the first cancer record for a given person corresponded to their first cancer ever diagnosed. An analysis of median times elapsed between successive cancer diagnoses resulted in the removal of the first five years of data (1992 to 1996) to minimize this potential source of bias. For comparability purposes, Quebec data were excluded from the sample used for the estimation of LPdying since the 2011-to-2018 Quebec records had not yet been submitted to the CCR when the analytical file was created. Ages 60 and 80 were chosen as empirical cut-offs because of the generalized increase in incidence counts after age 60 and in the number of deaths past age 80.
Results
Probability of developing cancer
The overall LPdev in 2018 is 44.3%, as shown in Table 1. Males have a slightly higher LPdev (45.1%) compared with females (43.5%). Among males, the top six cancers with the highest LPdev are prostate (12.3%), lung (6.9%), colorectal (6.2%), bladder (4.5%), non-Hodgkin lymphoma (NHL) (2.8%) and melanoma (2.5%) (Table 1). Among females, the top six cancers with the highest LPdev are breast (12.5%), lung (7.0%), colorectal (5.3%), uterus (3.3%), NHL (2.2%) and melanoma of the skin (2.0%). Generally, males have higher LPdev compared with females for all non-sex-specific cancers except for lung, thyroid and anal cancers.
| Cancer | Both sexes | Males | Females | ||||||
|---|---|---|---|---|---|---|---|---|---|
| Probability (%) |
95% confidence interval |
Probability (%) |
95% confidence interval |
Probability (%) |
95% confidence interval |
||||
| from | to | from | to | from | to | ||||
| All cancers | 44.3 | 44.0 | 44.5 | 45.1 | 44.7 | 45.5 | 43.5 | 43.2 | 43.9 |
| Lung and bronchus | 6.9 | 6.8 | 7.0 | 6.9 | 6.7 | 7.0 | 7.0 | 6.9 | 7.2 |
| Breast | 6.3 | 6.2 | 6.4 | 0.1 | 0.1 | 0.2 | 12.5 | 12.3 | 12.7 |
| Prostate | 6.1 | 6.0 | 6.2 | 12.3 | 12.1 | 12.5 | Note …: not applicable | Note …: not applicable | Note …: not applicable |
| Colorectal | 5.7 | 5.6 | 5.8 | 6.2 | 6.0 | 6.3 | 5.3 | 5.1 | 5.4 |
| Bladder (including in situ) | 2.9 | 2.8 | 3.0 | 4.5 | 4.4 | 4.6 | 1.4 | 1.3 | 1.4 |
| Non-Hodgkin lymphoma | 2.5 | 2.4 | 2.5 | 2.8 | 2.7 | 2.9 | 2.2 | 2.1 | 2.3 |
| Melanoma of the skin | 2.2 | 2.2 | 2.3 | 2.5 | 2.4 | 2.6 | 2.0 | 1.9 | 2.0 |
| Uterus (body, NOS) | 1.7 | 1.6 | 1.7 | Note …: not applicable | Note …: not applicable | Note …: not applicable | 3.3 | 3.2 | 3.4 |
| Kidney and renal pelvis | 1.6 | 1.5 | 1.6 | 2.0 | 2.0 | 2.1 | 1.1 | 1.1 | 1.2 |
| Pancreas | 1.5 | 1.5 | 1.6 | 1.5 | 1.5 | 1.6 | 1.5 | 1.4 | 1.6 |
| Head and neck | 1.5 | 1.5 | 1.5 | 2.1 | 2.1 | 2.2 | 0.9 | 0.8 | 0.9 |
| Leukemia | 1.5 | 1.4 | 1.5 | 1.8 | 1.7 | 1.8 | 1.2 | 1.2 | 1.3 |
| Thyroid | 1.3 | 1.2 | 1.3 | 0.7 | 0.7 | 0.8 | 1.8 | 1.7 | 1.9 |
| Stomach | 1.0 | 1.0 | 1.0 | 1.3 | 1.2 | 1.3 | 0.7 | 0.7 | 0.8 |
| Multiple myeloma | 0.9 | 0.9 | 0.9 | 1.1 | 1.0 | 1.1 | 0.7 | 0.7 | 0.8 |
| Brain and CNS | 0.7 | 0.6 | 0.7 | 0.8 | 0.7 | 0.8 | 0.6 | 0.5 | 0.6 |
| Ovary | 0.7 | 0.6 | 0.7 | Note …: not applicable | Note …: not applicable | Note …: not applicable | 1.3 | 1.2 | 1.4 |
| Esophagus | 0.6 | 0.6 | 0.7 | 1.0 | 0.9 | 1.0 | 0.3 | 0.3 | 0.4 |
| Liver (excluding intrahepatic bile ducts) | 0.6 | 0.6 | 0.7 | 0.9 | 0.9 | 1.0 | 0.3 | 0.3 | 0.4 |
| Soft tissues (including heart) | 0.4 | 0.4 | 0.4 | 0.4 | 0.4 | 0.5 | 0.3 | 0.3 | 0.4 |
| Cervix uteri | 0.3 | 0.3 | 0.4 | Note …: not applicable | Note …: not applicable | Note …: not applicable | 0.7 | 0.6 | 0.7 |
| Small intestine | 0.3 | 0.3 | 0.3 | 0.3 | 0.3 | 0.4 | 0.3 | 0.3 | 0.3 |
| Testis | 0.2 | 0.2 | 0.2 | 0.4 | 0.4 | 0.5 | Note …: not applicable | Note …: not applicable | Note …: not applicable |
| Hodgkin lymphoma | 0.2 | 0.2 | 0.2 | 0.2 | 0.2 | 0.3 | 0.2 | 0.2 | 0.2 |
| Anus | 0.2 | 0.2 | 0.2 | 0.2 | 0.1 | 0.2 | 0.3 | 0.3 | 0.3 |
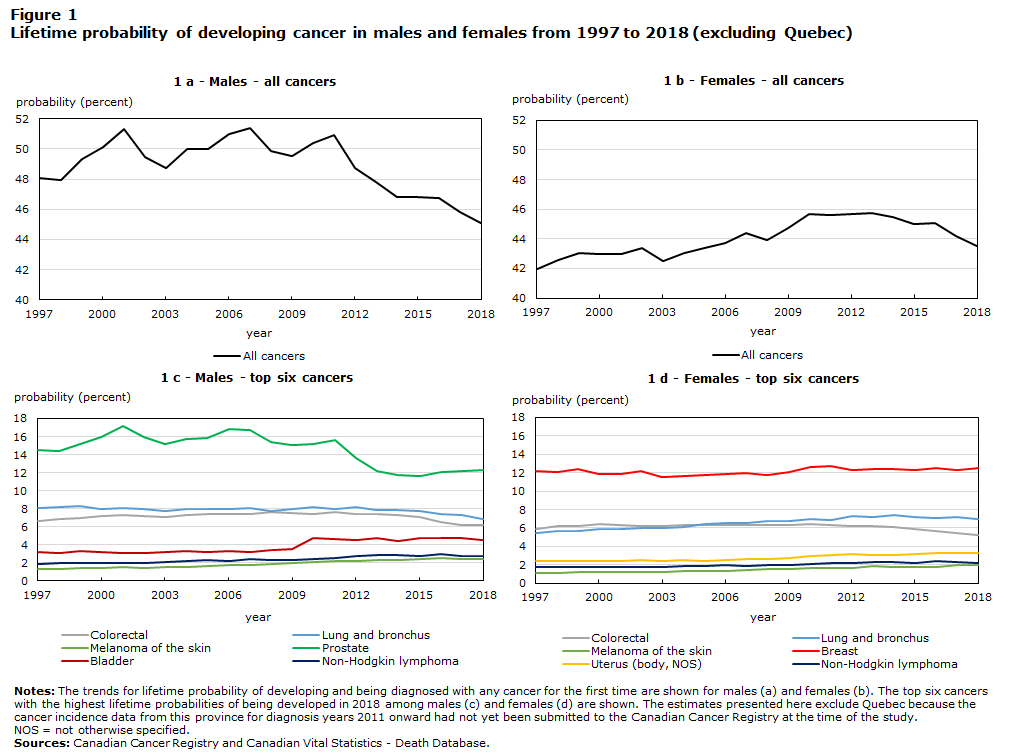
When LPdev trends for all cancers are examined by sex, there is an increase among females from 1997 to 2013 and a decrease afterward, whereas a consistently decreasing trend since 2010 is observed among males (Figure 1). Prostate cancer trends vary greatly over the years, and this may be explained by changes in prostate-specific antigen (PSA) testing and screening protocols.Note 12 In 2012, the U.S. Preventive Services Task Force advised against PSA testing, followed in 2014 by a similar decision from the Canadian Task Force on Preventive Health Care, triggering a subsequent decline in the diagnosis of new prostate cancer cases. The sudden increase of LPdev for male bladder cancer in 2010 coincides with the reporting of in situ tumour cases to the CCR by Ontario. Significant decreases in LPdev for both lung and colorectal cancers were observed in recent years (2014 to 2018).
Description of Figure 1
| Sex and year | Type of cancer | ||||||||
|---|---|---|---|---|---|---|---|---|---|
| Colorectal | Lung and bronchus | Melanoma of the skin | Prostate | Breast | Bladder | Uterus (body, NOS) |
Non-Hodgkin lymphoma | All cancers | |
| probability (percent) | |||||||||
| Males | |||||||||
| 1997 | 6.6 | 8.1 | 1.3 | 14.5 | Note …: not applicable | 3.2 | Note …: not applicable | 1.9 | 48.1 |
| 1998 | 6.9 | 8.2 | 1.3 | 14.4 | Note …: not applicable | 3.1 | Note …: not applicable | 1.9 | 48.0 |
| 1999 | 7.0 | 8.3 | 1.5 | 15.2 | Note …: not applicable | 3.3 | Note …: not applicable | 2.0 | 49.3 |
| 2000 | 7.2 | 8.0 | 1.5 | 15.9 | Note …: not applicable | 3.2 | Note …: not applicable | 2.0 | 50.1 |
| 2001 | 7.3 | 8.1 | 1.6 | 17.1 | Note …: not applicable | 3.1 | Note …: not applicable | 2.0 | 51.3 |
| 2002 | 7.2 | 8.0 | 1.5 | 16.0 | Note …: not applicable | 3.1 | Note …: not applicable | 2.0 | 49.5 |
| 2003 | 7.0 | 7.8 | 1.6 | 15.2 | Note …: not applicable | 3.2 | Note …: not applicable | 2.1 | 48.7 |
| 2004 | 7.4 | 8.0 | 1.6 | 15.7 | Note …: not applicable | 3.4 | Note …: not applicable | 2.2 | 50.0 |
| 2005 | 7.4 | 7.9 | 1.6 | 15.8 | Note …: not applicable | 3.2 | Note …: not applicable | 2.3 | 50.0 |
| 2006 | 7.4 | 8.0 | 1.8 | 16.8 | Note …: not applicable | 3.4 | Note …: not applicable | 2.2 | 51.0 |
| 2007 | 7.5 | 8.0 | 1.8 | 16.7 | Note …: not applicable | 3.3 | Note …: not applicable | 2.4 | 51.4 |
| 2008 | 7.7 | 7.8 | 1.9 | 15.4 | Note …: not applicable | 3.5 | Note …: not applicable | 2.3 | 49.9 |
| 2009 | 7.5 | 8.0 | 2.0 | 15.1 | Note …: not applicable | 3.5 | Note …: not applicable | 2.3 | 49.6 |
| 2010 | 7.4 | 8.2 | 2.1 | 15.2 | Note …: not applicable | 4.8 | Note …: not applicable | 2.5 | 50.4 |
| 2011 | 7.7 | 8.0 | 2.2 | 15.6 | Note …: not applicable | 4.6 | Note …: not applicable | 2.5 | 50.9 |
| 2012 | 7.4 | 8.2 | 2.2 | 13.6 | Note …: not applicable | 4.6 | Note …: not applicable | 2.8 | 48.7 |
| 2013 | 7.4 | 7.9 | 2.3 | 12.2 | Note …: not applicable | 4.7 | Note …: not applicable | 2.9 | 47.8 |
| 2014 | 7.3 | 7.9 | 2.4 | 11.7 | Note …: not applicable | 4.5 | Note …: not applicable | 2.9 | 46.8 |
| 2015 | 7.1 | 7.7 | 2.4 | 11.6 | Note …: not applicable | 4.7 | Note …: not applicable | 2.8 | 46.8 |
| 2016 | 6.6 | 7.4 | 2.5 | 12.1 | Note …: not applicable | 4.8 | Note …: not applicable | 3.0 | 46.7 |
| 2017 | 6.2 | 7.4 | 2.5 | 12.2 | Note …: not applicable | 4.7 | Note …: not applicable | 2.8 | 45.8 |
| 2018 | 6.2 | 6.9 | 2.5 | 12.3 | Note …: not applicable | 4.5 | Note …: not applicable | 2.8 | 45.1 |
| Females | |||||||||
| 1997 | 5.9 | 5.4 | 1.1 | Note …: not applicable | 12.2 | Note …: not applicable | 2.4 | 1.7 | 42.0 |
| 1998 | 6.2 | 5.7 | 1.1 | Note …: not applicable | 12.0 | Note …: not applicable | 2.4 | 1.8 | 42.6 |
| 1999 | 6.2 | 5.7 | 1.2 | Note …: not applicable | 12.4 | Note …: not applicable | 2.4 | 1.8 | 43.0 |
| 2000 | 6.4 | 5.9 | 1.2 | Note …: not applicable | 11.9 | Note …: not applicable | 2.5 | 1.7 | 43.0 |
| 2001 | 6.4 | 5.9 | 1.3 | Note …: not applicable | 11.8 | Note …: not applicable | 2.4 | 1.8 | 43.0 |
| 2002 | 6.2 | 6.0 | 1.2 | Note …: not applicable | 12.2 | Note …: not applicable | 2.5 | 1.8 | 43.4 |
| 2003 | 6.2 | 6.0 | 1.2 | Note …: not applicable | 11.5 | Note …: not applicable | 2.4 | 1.8 | 42.5 |
| 2004 | 6.3 | 6.2 | 1.3 | Note …: not applicable | 11.7 | Note …: not applicable | 2.5 | 1.9 | 43.1 |
| 2005 | 6.3 | 6.4 | 1.3 | Note …: not applicable | 11.8 | Note …: not applicable | 2.4 | 1.9 | 43.4 |
| 2006 | 6.3 | 6.6 | 1.4 | Note …: not applicable | 11.8 | Note …: not applicable | 2.6 | 2.0 | 43.7 |
| 2007 | 6.3 | 6.6 | 1.5 | Note …: not applicable | 12.0 | Note …: not applicable | 2.6 | 1.9 | 44.4 |
| 2008 | 6.3 | 6.7 | 1.5 | Note …: not applicable | 11.7 | Note …: not applicable | 2.6 | 2.0 | 43.9 |
| 2009 | 6.3 | 6.8 | 1.6 | Note …: not applicable | 12.1 | Note …: not applicable | 2.8 | 2.0 | 44.7 |
| 2010 | 6.4 | 7.0 | 1.6 | Note …: not applicable | 12.6 | Note …: not applicable | 3.0 | 2.1 | 45.7 |
| 2011 | 6.3 | 6.9 | 1.7 | Note …: not applicable | 12.7 | Note …: not applicable | 3.0 | 2.2 | 45.6 |
| 2012 | 6.3 | 7.3 | 1.6 | Note …: not applicable | 12.3 | Note …: not applicable | 3.1 | 2.2 | 45.7 |
| 2013 | 6.3 | 7.2 | 1.8 | Note …: not applicable | 12.4 | Note …: not applicable | 3.1 | 2.4 | 45.8 |
| 2014 | 6.2 | 7.5 | 1.8 | Note …: not applicable | 12.4 | Note …: not applicable | 3.1 | 2.3 | 45.5 |
| 2015 | 5.9 | 7.2 | 1.8 | Note …: not applicable | 12.3 | Note …: not applicable | 3.2 | 2.2 | 45.0 |
| 2016 | 5.7 | 7.1 | 1.8 | Note …: not applicable | 12.6 | Note …: not applicable | 3.3 | 2.4 | 45.1 |
| 2017 | 5.5 | 7.2 | 2.0 | Note …: not applicable | 12.3 | Note …: not applicable | 3.3 | 2.3 | 44.2 |
| 2018 | 5.3 | 7.0 | 2.0 | Note …: not applicable | 12.5 | Note …: not applicable | 3.3 | 2.2 | 43.5 |
Probability of dying from cancer
The overall LPdying in 2020 is 22.5% (Table 2). Overall, males have a higher LPdying (24.1%) than females (21.1%). The top six cancers with the highest LPdying among males are lung (5.0%), prostate (3.3%), colorectal (2.7%), pancreas (1.5%), bladder (1.1%) and NHL (1.0%). The top six cancers among females are lung (4.8%), breast (2.8%), colorectal (2.4%), pancreas (1.5%), ovary (1.0%) and NHL (0.8%). The LPdying among females for all non-sex-specific cancers other than breast is consistently lower than among males.
| Cancer | Both sexes | Males | Females | ||||||
|---|---|---|---|---|---|---|---|---|---|
| Probability (%) |
95% confidence interval |
Probability (%) |
95% confidence interval |
Probability (%) |
95% confidence interval |
||||
| from | to | from | to | from | to | ||||
| All cancers | 22.5 | 22.4 | 22.7 | 24.1 | 23.9 | 24.4 | 21.1 | 20.9 | 21.4 |
| Lung and bronchus | 4.9 | 4.8 | 5.0 | 5.0 | 4.9 | 5.2 | 4.8 | 4.7 | 4.9 |
| Colorectal | 2.5 | 2.4 | 2.6 | 2.7 | 2.6 | 2.8 | 2.4 | 2.3 | 2.5 |
| Colon | 1.8 | 1.7 | 1.8 | 1.8 | 1.8 | 1.9 | 1.7 | 1.7 | 1.8 |
| Prostate | 1.6 | 1.6 | 1.7 | 3.3 | 3.2 | 3.4 | Note …: not applicable | Note …: not applicable | Note …: not applicable |
| Pancreas | 1.5 | 1.4 | 1.5 | 1.5 | 1.4 | 1.6 | 1.5 | 1.4 | 1.5 |
| Breast | 1.4 | 1.4 | 1.5 | 0.0 | 0.0 | 0.1 | 2.8 | 2.7 | 2.9 |
| Non-Hodgkin lymphoma | 0.9 | 0.9 | 0.9 | 1.0 | 0.9 | 1.1 | 0.8 | 0.8 | 0.9 |
| Leukemia | 0.9 | 0.8 | 0.9 | 1.0 | 0.9 | 1.1 | 0.7 | 0.7 | 0.8 |
| Bladder (including in situ) | 0.7 | 0.7 | 0.8 | 1.1 | 1.0 | 1.2 | 0.4 | 0.4 | 0.4 |
| Esophagus | 0.6 | 0.6 | 0.6 | 0.9 | 0.9 | 1.0 | 0.3 | 0.3 | 0.3 |
| Brain and CNS | 0.6 | 0.5 | 0.6 | 0.7 | 0.6 | 0.7 | 0.5 | 0.4 | 0.5 |
| Stomach | 0.5 | 0.5 | 0.6 | 0.7 | 0.6 | 0.7 | 0.4 | 0.4 | 0.5 |
| Head and neck | 0.5 | 0.5 | 0.6 | 0.7 | 0.7 | 0.8 | 0.3 | 0.3 | 0.4 |
| Kidney and renal pelvis | 0.5 | 0.5 | 0.5 | 0.6 | 0.6 | 0.7 | 0.4 | 0.3 | 0.4 |
| Ovary | 0.5 | 0.5 | 0.5 | Note …: not applicable | Note …: not applicable | Note …: not applicable | 1.0 | 0.9 | 1.0 |
| Multiple myeloma | 0.4 | 0.4 | 0.5 | 0.5 | 0.5 | 0.6 | 0.4 | 0.3 | 0.4 |
| Uterus (body, NOS) | 0.4 | 0.4 | 0.4 | Note …: not applicable | Note …: not applicable | Note …: not applicable | 0.7 | 0.7 | 0.8 |
| Liver (excluding intrahepatic bile ducts) | 0.4 | 0.3 | 0.4 | 0.6 | 0.5 | 0.6 | 0.2 | 0.2 | 0.2 |
| Melanoma of the skin | 0.3 | 0.3 | 0.4 | 0.4 | 0.4 | 0.5 | 0.2 | 0.2 | 0.3 |
| Soft tissues (including heart) | 0.2 | 0.1 | 0.2 | 0.2 | 0.2 | 0.2 | 0.1 | 0.1 | 0.2 |
| Cervix uteri | 0.1 | 0.1 | 0.1 | Note …: not applicable | Note …: not applicable | Note …: not applicable | 0.2 | 0.2 | 0.2 |
| Thyroid | 0.1 | 0.1 | 0.1 | 0.1 | 0.1 | 0.1 | 0.1 | 0.1 | 0.1 |
| Small intestine | 0.1 | 0.1 | 0.1 | 0.1 | 0.1 | 0.1 | 0.1 | 0.1 | 0.1 |
| Anus | 0.1 | 0.0 | 0.1 | 0.0 | 0.0 | 0.1 | 0.1 | 0.1 | 0.1 |
| Hodgkin lymphoma | 0.0 | 0.0 | 0.0 | 0.0 | 0.0 | 0.1 | 0.0 | 0.0 | 0.0 |
| Testis | 0.0 | 0.0 | 0.0 | 0.0 | 0.0 | 0.0 | Note …: not applicable | Note …: not applicable | Note …: not applicable |
For all cancers combined, the LPdying trend for females increases between 1997 and 2003, remains unchanged until 2016, then follows with a subsequent decrease (Figure 2). For males, an increase is observed between 1997 and 2001, then a plateau until 2014 and a decrease from 2015 onward (Figure 2). The LPdying estimates for both prostate cancer (-0.5% annually) and female breast cancer (-1.1% annually) have declined steadily from 1997 to 2020. Since 2014, the LPdying for both lung and colorectal cancers has undergone a marked annual decrease among both males (lung: -3.8%; colorectal: -2.9%) and females (‑3.0% in both cases).

Description of Figure 2
| Sex and year | Type of cancer | ||||||||
|---|---|---|---|---|---|---|---|---|---|
| Colorectal | Pancreas | Lung and bronchus | Prostate | Breast | Bladder | Ovary | Non-Hodgkin lymphoma | All cancers | |
| probability (percent) | |||||||||
| Males | |||||||||
| 1997 | 3.2 | 1.1 | 7.1 | 3.8 | Note …: not applicable | 0.9 | Note …: not applicable | 1.0 | 25.7 |
| 1998 | 3.3 | 1.2 | 7.2 | 3.8 | Note …: not applicable | 0.9 | Note …: not applicable | 1.0 | 25.9 |
| 1999 | 3.3 | 1.2 | 7.4 | 3.7 | Note …: not applicable | 1.0 | Note …: not applicable | 1.1 | 26.3 |
| 2000 | 3.4 | 1.2 | 7.0 | 3.8 | Note …: not applicable | 1.0 | Note …: not applicable | 1.1 | 26.7 |
| 2001 | 3.4 | 1.3 | 7.2 | 4.0 | Note …: not applicable | 1.0 | Note …: not applicable | 1.1 | 27.3 |
| 2002 | 3.5 | 1.2 | 7.1 | 3.8 | Note …: not applicable | 1.0 | Note …: not applicable | 1.0 | 27.2 |
| 2003 | 3.4 | 1.3 | 7.1 | 3.8 | Note …: not applicable | 1.0 | Note …: not applicable | 1.0 | 27.1 |
| 2004 | 3.5 | 1.3 | 6.9 | 3.9 | Note …: not applicable | 1.1 | Note …: not applicable | 1.1 | 27.2 |
| 2005 | 3.5 | 1.3 | 7.1 | 3.7 | Note …: not applicable | 1.0 | Note …: not applicable | 1.0 | 27.1 |
| 2006 | 3.3 | 1.3 | 7.0 | 3.7 | Note …: not applicable | 1.1 | Note …: not applicable | 1.0 | 27.3 |
| 2007 | 3.3 | 1.3 | 6.8 | 3.8 | Note …: not applicable | 1.1 | Note …: not applicable | 1.1 | 27.0 |
| 2008 | 3.5 | 1.3 | 6.7 | 3.7 | Note …: not applicable | 1.2 | Note …: not applicable | 1.0 | 27.1 |
| 2009 | 3.4 | 1.4 | 6.9 | 3.7 | Note …: not applicable | 1.2 | Note …: not applicable | 1.1 | 27.3 |
| 2010 | 3.3 | 1.3 | 6.8 | 3.8 | Note …: not applicable | 1.2 | Note …: not applicable | 1.0 | 27.0 |
| 2011 | 3.4 | 1.4 | 6.7 | 3.6 | Note …: not applicable | 1.2 | Note …: not applicable | 1.0 | 27.1 |
| 2012 | 3.3 | 1.4 | 6.6 | 3.6 | Note …: not applicable | 1.2 | Note …: not applicable | 1.1 | 27.3 |
| 2013 | 3.3 | 1.5 | 6.3 | 3.6 | Note …: not applicable | 1.3 | Note …: not applicable | 1.0 | 27.0 |
| 2014 | 3.3 | 1.5 | 6.5 | 3.7 | Note …: not applicable | 1.3 | Note …: not applicable | 1.0 | 27.1 |
| 2015 | 3.1 | 1.5 | 6.2 | 3.5 | Note …: not applicable | 1.2 | Note …: not applicable | 1.1 | 26.3 |
| 2016 | 3.1 | 1.5 | 5.9 | 3.7 | Note …: not applicable | 1.3 | Note …: not applicable | 1.0 | 26.5 |
| 2017 | 3.0 | 1.5 | 5.9 | 3.5 | Note …: not applicable | 1.2 | Note …: not applicable | 1.1 | 26.0 |
| 2018 | 2.9 | 1.5 | 5.7 | 3.4 | Note …: not applicable | 1.2 | Note …: not applicable | 1.0 | 25.5 |
| 2019 | 3.0 | 1.6 | 5.4 | 3.5 | Note …: not applicable | 1.1 | Note …: not applicable | 1.0 | 25.6 |
| 2020 | 2.7 | 1.5 | 5.0 | 3.3 | Note …: not applicable | 1.1 | Note …: not applicable | 1.0 | 24.1 |
| Females | |||||||||
| 1997 | 3.0 | 1.2 | 4.3 | Note …: not applicable | 3.7 | Note …: not applicable | 1.1 | 0.9 | 21.5 |
| 1998 | 3.1 | 1.3 | 4.6 | Note …: not applicable | 3.6 | Note …: not applicable | 1.1 | 0.9 | 22.0 |
| 1999 | 3.1 | 1.3 | 4.8 | Note …: not applicable | 3.5 | Note …: not applicable | 1.1 | 0.9 | 22.5 |
| 2000 | 3.1 | 1.3 | 4.8 | Note …: not applicable | 3.6 | Note …: not applicable | 1.1 | 0.9 | 22.7 |
| 2001 | 3.1 | 1.3 | 4.8 | Note …: not applicable | 3.6 | Note …: not applicable | 1.1 | 0.9 | 22.6 |
| 2002 | 3.0 | 1.3 | 4.9 | Note …: not applicable | 3.6 | Note …: not applicable | 1.2 | 0.9 | 22.8 |
| 2003 | 3.0 | 1.3 | 5.0 | Note …: not applicable | 3.7 | Note …: not applicable | 1.2 | 0.9 | 23.2 |
| 2004 | 3.1 | 1.4 | 5.1 | Note …: not applicable | 3.5 | Note …: not applicable | 1.2 | 0.9 | 23.2 |
| 2005 | 3.0 | 1.3 | 5.1 | Note …: not applicable | 3.4 | Note …: not applicable | 1.1 | 0.9 | 22.8 |
| 2006 | 2.9 | 1.3 | 5.4 | Note …: not applicable | 3.3 | Note …: not applicable | 1.1 | 0.9 | 22.8 |
| 2007 | 3.1 | 1.4 | 5.3 | Note …: not applicable | 3.4 | Note …: not applicable | 1.1 | 0.9 | 23.1 |
| 2008 | 2.9 | 1.3 | 5.4 | Note …: not applicable | 3.2 | Note …: not applicable | 1.1 | 0.9 | 22.8 |
| 2009 | 3.0 | 1.4 | 5.5 | Note …: not applicable | 3.2 | Note …: not applicable | 1.1 | 0.8 | 23.0 |
| 2010 | 2.9 | 1.4 | 5.6 | Note …: not applicable | 3.2 | Note …: not applicable | 1.1 | 0.8 | 23.3 |
| 2011 | 3.0 | 1.4 | 5.3 | Note …: not applicable | 3.2 | Note …: not applicable | 1.1 | 0.8 | 23.0 |
| 2012 | 2.9 | 1.5 | 5.4 | Note …: not applicable | 3.2 | Note …: not applicable | 1.0 | 0.9 | 23.1 |
| 2013 | 2.9 | 1.5 | 5.5 | Note …: not applicable | 3.1 | Note …: not applicable | 1.1 | 0.8 | 23.0 |
| 2014 | 2.9 | 1.5 | 5.5 | Note …: not applicable | 3.1 | Note …: not applicable | 1.1 | 0.8 | 22.9 |
| 2015 | 2.7 | 1.5 | 5.4 | Note …: not applicable | 3.1 | Note …: not applicable | 1.1 | 0.9 | 22.6 |
| 2016 | 2.8 | 1.5 | 5.4 | Note …: not applicable | 3.2 | Note …: not applicable | 1.0 | 0.8 | 23.0 |
| 2017 | 2.6 | 1.5 | 5.3 | Note …: not applicable | 3.1 | Note …: not applicable | 1.0 | 0.8 | 22.4 |
| 2018 | 2.5 | 1.5 | 5.1 | Note …: not applicable | 3.0 | Note …: not applicable | 1.0 | 0.8 | 21.8 |
| 2019 | 2.5 | 1.5 | 5.0 | 2.9 | Note …: not applicable | 1.0 | 0.7 | 21.5 | |
| 2020 | 2.4 | 1.5 | 4.8 | 2.8 | Note …: not applicable | 1.0 | 0.8 | 21.1 | |
Age-conditional lifetime probability
Past age 80, the risk of developing cancer decreases because of competing non-cancer mortality and reduced remaining lifespan. Consequently, lower probabilities are observed at age 80 than at age 60 (Table 3). The remaining lifetime probability of developing cancer conditional on attaining the age of 60 (AC60dev) in 2018 is 44.0% for males and 38.2% for females. As the AC60dev is similar to the LPdev (Table 1) for all cancers, this suggests that the probability of receiving a first cancer diagnosis does not vary significantly before age 60. The remaining lifetime probability of developing cancer conditional on attaining the age of 80 is 27.5% for males and 22.4% for females, indicating that cancer-free people who survive to age 80 have a 40% reduced probability of developing cancer within their remaining years of life compared with newborns or people aged 60 years.
| Cancer | Males | Females | ||||||||||
|---|---|---|---|---|---|---|---|---|---|---|---|---|
| At age 60 | At age 80 | At age 60 | At age 80 | |||||||||
| Probability (%) |
95% confidence interval |
Probability (%) |
95% confidence interval |
Probability (%) |
95% confidence interval |
Probability (%) |
95% confidence interval |
|||||
| from | to | from | to | from | to | from | to | |||||
| Developing | ||||||||||||
| All cancers | 44.0 | 43.6 | 44.5 | 27.5 | 27.0 | 28.1 | 38.2 | 37.8 | 35.5 | 22.4 | 22.0 | 22.9 |
| Lung and bronchus | 7.1 | 6.9 | 7.2 | 4.0 | 3.9 | 4.2 | 6.8 | 6.7 | 7.0 | 3.2 | 3.1 | 3.4 |
| Breast | 0.1 | 0.1 | 0.2 | 0.0 | 0.0 | 0.1 | 9.5 | 9.3 | 9.7 | 4.0 | 3.9 | 4.2 |
| Prostate | 12.3 | 12.1 | 12.5 | 5.0 | 4.8 | 5.2 | Note …: not applicable | Note …: not applicable | Note …: not applicable | Note …: not applicable | Note …: not applicable | Note …: not applicable |
| Colorectal | 5.8 | 5.6 | 5.9 | 3.6 | 3.4 | 3.7 | 4.7 | 4.6 | 4.8 | 3.1 | 2.9 | 3.2 |
| Bladder (including in situ) | 4.6 | 4.5 | 4.8 | 3.1 | 3.0 | 3.3 | 1.3 | 1.3 | 1.4 | 0.8 | 0.7 | 0.9 |
| Non-Hodgkin lymphoma | 2.5 | 2.4 | 2.6 | 1.5 | 1.4 | 1.6 | 1.9 | 1.8 | 2.0 | 1.0 | 0.9 | 1.1 |
| Melanoma of the skin | 2.2 | 2.1 | 2.3 | 1.3 | 1.2 | 1.4 | 1.5 | 1.4 | 1.5 | 0.7 | 0.7 | 0.8 |
| Uterus (body, NOS) | Note …: not applicable | Note …: not applicable | Note …: not applicable | Note …: not applicable | Note …: not applicable | Note …: not applicable | 2.6 | 2.5 | 2.7 | 0.8 | 0.7 | 0.8 |
| Kidney and renal pelvis | 1.7 | 1.6 | 1.8 | 0.7 | 0.6 | 0.7 | 0.9 | 0.9 | 1.0 | 0.4 | 0.3 | 0.4 |
| Pancreas | 1.5 | 1.4 | 1.6 | 0.9 | 0.8 | 0.9 | 1.4 | 1.4 | 1.5 | 0.9 | 0.8 | 1.0 |
| Head and neck | 1.8 | 1.8 | 1.9 | 0.8 | 0.8 | 0.9 | 0.7 | 0.7 | 0.8 | 0.4 | 0.3 | 0.4 |
| Leukemia | 1.5 | 1.4 | 1.6 | 0.9 | 0.8 | 1.0 | 1.0 | 0.9 | 1.1 | 0.6 | 0.5 | 0.6 |
| Thyroid | 0.4 | 0.4 | 0.4 | 0.1 | 0.1 | 0.1 | 0.7 | 0.7 | 0.8 | 0.2 | 0.2 | 0.2 |
| Stomach | 1.2 | 1.2 | 1.3 | 0.7 | 0.7 | 0.8 | 0.6 | 0.6 | 0.7 | 0.4 | 0.4 | 0.4 |
| Dying | ||||||||||||
| All cancers | 25.1 | 24.8 | 25.4 | 20.4 | 20.0 | 20.7 | 20.5 | 20.2 | 20.7 | 14.8 | 14.5 | 15.0 |
| Lung and bronchus | 5.4 | 5.2 | 5.5 | 3.6 | 3.5 | 3.8 | 4.9 | 4.7 | 5.0 | 3.0 | 2.9 | 3.1 |
| Colorectal | 2.7 | 2.6 | 2.8 | 2.3 | 2.2 | 2.4 | 2.3 | 2.2 | 2.4 | 2.0 | 1.9 | 2.1 |
| Prostate | 3.7 | 3.5 | 3.8 | 3.9 | 3.8 | 4.1 | Note …: not applicable | Note …: not applicable | Note …: not applicable | Note …: not applicable | Note …: not applicable | Note …: not applicable |
| Pancreas | 1.5 | 1.5 | 1.6 | 1.0 | 0.9 | 1.1 | 1.5 | 1.4 | 1.5 | 1.0 | 1.0 | 1.1 |
| Breast | 0.0 | 0.0 | 0.1 | 0.0 | 0.0 | 0.0 | 2.5 | 2.4 | 2.6 | 1.8 | 1.7 | 1.9 |
| Non-Hodgkin lymphoma | 1.0 | 1.0 | 1.1 | 0.9 | 0.8 | 1.0 | 0.8 | 0.8 | 0.9 | 0.7 | 0.6 | 0.7 |
| Leukemia | 1.0 | 1.0 | 1.1 | 0.9 | 0.8 | 1.0 | 0.7 | 0.7 | 0.8 | 0.6 | 0.5 | 0.7 |
| Bladder (including in situ) | 1.2 | 1.1 | 1.3 | 1.3 | 1.2 | 1.4 | 0.4 | 0.4 | 0.5 | 0.4 | 0.3 | 0.4 |
| Stomach | 0.7 | 0.6 | 0.7 | 0.5 | 0.5 | 0.6 | 0.4 | 0.4 | 0.4 | 0.3 | 0.3 | 0.3 |
| Head and neck | 0.7 | 0.7 | 0.8 | 0.4 | 0.4 | 0.5 | 0.3 | 0.3 | 0.3 | 0.2 | 0.2 | 0.3 |
| Kidney and renal pelvis | 0.6 | 0.6 | 0.7 | 0.5 | 0.5 | 0.6 | 0.4 | 0.3 | 0.4 | 0.3 | 0.2 | 0.3 |
| Uterus (body, NOS) | Note …: not applicable | Note …: not applicable | Note …: not applicable | Note …: not applicable | Note …: not applicable | Note …: not applicable | 0.7 | 0.7 | 0.8 | 0.4 | 0.4 | 0.5 |
| Melanoma of the skin | 0.4 | 0.4 | 0.5 | 0.4 | 0.3 | 0.4 | 0.2 | 0.2 | 0.3 | 0.2 | 0.1 | 0.2 |
| Thyroid | 0.1 | 0.1 | 0.1 | 0.1 | 0.1 | 0.1 | 0.1 | 0.1 | 0.1 | 0.1 | 0.0 | 0.1 |
Similar trends can be described for the risk of dying from cancer in 2020. The increased risk of dying from non-cancer causes at age 80 results in a lower remaining lifetime probability of dying from cancer after age 80 (AC80dying) than after age 60 (AC60dying) (Table 3). Overall, the AC60dying for both sexes (males: 25.1%; females: 20.5%) (Table 3) is comparable with the respective LPdying (Table 2), thereby suggesting that the probability of dying from cancer, at the population level, is very small before the age of 60. AC80dying for males (20.4%) and females (14.8%) is about 5 percentage points lower at age 80 than at age 60 (Table 3).
Discussion
This article presents an overview of the estimated LPdev and LPdying for cancer among Canadians. These lifetime cancer risk estimates are conceptually simple indicators that control for background mortality. All-cause age-standardized mortality rates have decreased since 2000; however, crude mortality rates keep rising as a result of the increased longevity of Canadians.Note 12 These findings will likely result in growing LPdev and LPdying despite declining age-standardized rates.
The results of this analysis are highly comparable with the findings reported in Canadian Cancer Statistics 2021 that presented probabilities for 2017.Note 6 The overall LPdev among Canadians in 2018 (at 45.1% for males and 43.5% for females) is slightly higher, by roughly 5 percentage points, than the reported estimates for the United States and the United Kingdom.Note 13, Note 14 LPdying among Canadians (at 24.1% for males and 21.1% for females) is comparable with U.S. estimates.Note 13 Reasons for the higher risk of developing cancer or dying from cancer in Canada compared with its neighbour are multifactorial. Higher LPdying among Canadians compared with Americans is partly attributable to differences in the national distribution of underlying causes of death, non-cancer causes of death accounting for 72.5% of all deaths in Canada in 2020 compared with 80.2% of all deaths in the United States.Note 15, Note 16 Americans face differing public health issues; 72 per 100,000 Americans have an underlying cause of death related to high body mass index leading to probable events of cardiovascular disease and diabetes mellitus, whereas the same issue in Canada affected 45.2 per 100,000 individuals in 2017.Note 17, Note 18 Age-standardized mortality rates for injury are also elevated in the United States, with 46 per 100,000 deaths among Americans versus 33 per 100,000 deaths among Canadians in 2017, competing with cancer-related deaths.Note 19 For breast and prostate cancers, the United Kingdom and the Netherlands have LPdev estimates comparable with those calculated in Canada.Note 20, Note 21 These two cancers are characterized by a higher five-year net survival (breast: 88%; prostate: 93%) compared with other commonly diagnosed cancers, such as lung cancer (19%), and consequently have lower LPdying. Interestingly, the higher estimate for AC80dying than for AC60dying for prostate cancer is attributable to a clustering of prostate cancer deaths after age 80.
Lung cancer trends in both LPdev and LPdying reveal marked differences between sexes; the male trend shows a steady decrease, while the female trend exhibits an increase until 2014, then initiates a decline from 2015 onward. This finding coincides with past differences in tobacco use, where decreases in smoking prevalence among males in Canada started around the 1960s, while a decrease was not observed among females until the 1980s.Note 22 Ovarian and pancreatic cancers have lower incidence rates but high mortality rates, and this is reflected in their LPdev and LPdying.Note 4, Note 23, Note 24 This finding is attributable to the poor prognoses associated with both cancer types.Note 25, Note 26 Other cancers are characterized by varying trends in LPdev and LPdying, notably with increases in risk among melanoma and pancreatic cancer, no changes in risk among head and neck cancers, and a decreasing trajectory for NHL and colorectal cancer. These changes foreshadow a shifting landscape in the Canadian cancer burden that will be reflected in the observed prevalence within the coming years.
Strengths and limitations
The CCR and CVSD are the most comprehensive national-level data sources for cancer incidence and mortality in Canada. Quebec had not submitted cancer incidence data to the CCR since the 2010 diagnosis year and Yukon had not submitted death records to CVSD since 2016 at the time of the study. Consequently, the results of this analysis are not representative of Canada as a whole; this restricts the comparative potential of this study’s findings. Furthermore, estimates are based on cross-sectional annual data and, as such, are subject to period effects that may incorrectly reflect the lifetime probability of a given cohort. Lastly, the calculations assume a constant rate of incidence and mortality within each age group, an assumption that may not hold for older age groups and may result in a slight downward bias in the calculation of probabilities at the end of the lifespan.
Conclusion
This study presents the latest estimates of LPdev and LPdying for cancer among Canadians up to 2018 and 2020, respectively. The findings provide insight into the cancer-specific evolution of these probabilities over time—crucial information for both clinical programs and cancer policy management institutions.