
Cardiovascular
The triglyceride-glucose index is a predictor for cardiovascular and all-cause mortality in CVD patients with diabetes or pre-diabetes: evidence from NHANES 2001–2018
Oct
Study population and design
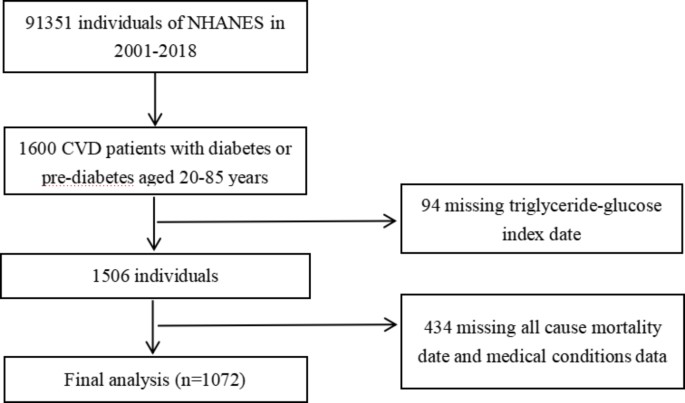
The National Health and Nutrition Examination Survey (NHANES) is a crucial research program that aims to evaluate the health and nutritional status of both adults and children residing in the United States. The Centers for Disease Control and Prevention (CDC) is responsible for furnishing health statistics for the nation, and the protocols of NHANES have been duly approved by the Research Ethics Review Board of NCHS. To ensure the protection of the participants’ rights, NHANES has obtained informed written consent from all the individuals involved in the study. Moreover, the datasets generated and analyzed in the current study are readily available on the official NHANES website (https://www.cdc.gov/nchs/nhanes/index.html). We downloaded data of NHANES from 2001 to 2018. According to the ADA’s diabetes diagnostic criteria, diabetes is defined by self-reported diagnosis, use of insulin or oral hypoglycemic medication, FBG ≥ 126 mg/dL or HbA1c level ≥ 6.5%. Prediabetes is identified by self-reported prediabetes status or having FBG between 100 mg/dL and 125 mg/dL, or HbA1c between 5.7% and 6.4% [15]. The diagnosis of CVD was established by self-reported physician diagnoses obtained during an individual interview using a standardized medical condition questionnaire. The participants were asked,“Has a doctor or other health expert ever informed you that you have CHF/CHD/angina pectoris/MI/stroke?” A person was regarded as having CVD if he or she replied “yes” to any of the above questions. A total of 1600 adults with CVD and diabetes or pre-diabetes were surveyed (aged 20 to 85 years old). After excluding those who missed triglyceride-glucose index date (n = 94) or missed all cause mortality date and medical conditions data (n = 434) at baseline, 1072 participants were included in the current study (Fig. 1).
Flow chart of study participants
Assessment of covariates
Information on various demographic and health-related factors was gathered, including age, sex, race/ethnicity, education level, family income, smoking status, disease status, and medication use, from NHANES household interviews. Body mass index (BMI) was calculated as weight in kilograms divided by height in meters squared. Race/ethnicity was categorized as White, Black, Mexican, or Other, while education level was classified as less than high school, high school or equivalent, or college or above. Household income and poverty rate are divided into 0–1.0, 1.0–3.0, or > 3.0. Smoking status was recorded as never smoker, former smoker, or current smoker. Drinking status was categorized into heavy drinker (defined as consuming ≥ 3 drinks per day for females, ≥ 4 drinks per day for males, or binge drinking [≥ 4 drinks on the same occasion for females, ≥ 5 drinks on the same occasion for males] on 5 or more days per month), moderate drinker (defined as consuming ≥ 2 drinks per day for females, ≥ 3 drinks per day for males, or binge drinking ≥ 2 days per month), mild drinker (not meeting the above criteria), nondrinker, or a history of daily binge drinking. Clinical indicators such as fasting glucose, HbA1c, triglycerides (TG), total cholesterol (TC), low-density lipoprotein cholesterol (LDL-C), and high-density lipoprotein cholesterol (HDL-C) were measured in the NHANES laboratory.
Assessment of TyG index
The TyG index was calculated by TyG index = Ln [fasting TG (mg/dL) × fasting glucose (mg/dL)/2]. The measurement of triglycerides and fasting glucose were measured through enzymatic assays on Roche Modular P and Roche Cobas 6000 chemistry analyzers, respectively. The hexokinase-mediated reaction was utilized on Roche/Hitachi Cobas C 501 chemistry analyzers for measuring fasting glucose. The participants were classifed into four groups (Q1, Q2, Q3, Q4) by the quartiles of TyG index, and the Q1 group was used as the reference group.
Ascertainment of mortality
In order to ascertain the mortality status in the follow-up population, we employed the NHANES public-use linked mortality file as of December 31, 2019. This file was linked with the National Death Index (NDI) by the National Center for Health Statistics (NCHS) via a probability matching algorithm. Moreover, we used the International Statistical Classification of Diseases, 10th Revision (ICD-10) to determine disease-specific deaths, with the NCHS classifying heart diseases (054–064), malignant neoplasms (019–043), and all other causes (010) for our study [16].
Statistical analysis
The statistical analysis was performed using R software (version 4.2.1; https://www.r-project.org). Sample weights, clustering, and stratification were incorporated in all analyses because of the complex sampling design of the NHANES, as required to analyze the NHANES data [17]. Study participants were classified into four groups according to quartiles (Q1-Q4) of the TyG index. Continuous variables were summarized as mean and standard deviation (SD), while categorical variables were presented as frequency and percentage. The comparison of baseline characteristics across TyG quartile groups was performed using one-way ANOVA for continuous variables and Pearson chi-square test for categorical variables. The incidence rates of all-cause mortality and CVD mortality for each TyG quartile group were computed during the total follow-up period. To evaluate the independent predictive value of the TyG index, we developed multivariate Cox proportional hazards regression models, which included three models to control for confounding factors. Model 1 was unadjusted, Model 2 was adjusted for age, race, and gender, and Model 3 was adjusted for age, gender, race, BMI, tobacco use, alcohol use, education, hypertension, and family income-poverty ratio. Multiple imputation was performed for covariates with missing values. To investigate the relationship between TyG index and mortality, Cox proportional hazards regression models with restricted cubic splines and smooth curve fitting (penalized spline method) were conducted. If the relationship was nonlinear, we estimate the threshold value by trying all possible values and choosing the threshold point with the highest likelihood. And we use two-piecewise Cox proportional risk model on both sides of the inflection point to investigate the association between TyG index and the risk of all-cause mortality and CVD mortality. Stratified analyses were conducted based on gender, age (< 60 years old or ≥ 60 years old), BMI (< 25.00 or ≥ 25.00) and race (White, Black, Mexican, or Other). A p-value of less than 0.05 was considered statistically significant.