
Cardiovascular
Glycemic control, HbA1c variability, and major cardiovascular adverse outcomes in type 2 diabetes patients with elevated cardiovascular risk: insights from the ACCORD study
Oct
Baseline characteristics
The ACCORD study enrolled 10,251 participants, of which 5,128 were randomized to achieve a target glycated hemoglobin level < 6·0% (intensive treatment group). We excluded 199 participants whose HVS could not be calculated. Hence, our post-hoc analysis included 10,052 participants. The mean age of the participants was 62·7 years (SD 6·62), and 6,196 (61·6%) of the participants were men. After a median follow-up of 4·82 years, MACEs occurred in 1,015 participants, and all-cause mortality occurred in 668 participants. The baseline characteristics and crude outcomes of the included participants are presented in Table 1. Under different variability groupings, the baseline characteristics between the intensive management group and the standard management group were essentially consistent (Table S2).
Clustering results
Patients who received intensive treatment had a relatively lower HVS and higher SD (Table S3). We classified all participants into three groups (low, medium, and high HbA1c variability). Quantile partitioning is the traditional method of clustering participants into three equal groups of the population (Table S4). Two machine learning algorithms created a smaller group of participants with a high level of HbA1c variability: 16·3% by K-means and 24·4% by K-medians. Quantile partitioning clusters were purely based on HbA1c record variation, while the machine learning model considered both the HVS and the SD (Figure S1). In the low, medium, and high variability groups, the mean values of HVS are 19.29, 45.44, and 75.95, respectively, while the mean values of SD are also 0.53, 0.77, and 1.06, respectively (K-means). Cut-off values for the HVS and SD among the clustering methods were comparable (Table S3, S4). In the high variability group, the effect of intensive blood glucose control was the lowest and relatively increased HbA1c variability. Conversely, in the low variability group, intensive blood glucose control had the best glucose-lowering effect and significantly reduced blood HbA1c variability. All three evaluation indicators for the clustering methods showed that the K-means method had the best performance (Davies-Bouldin Index: 0·570, Silhouette Index: 0·523, Calinski-Harabaz Index: 23,041·551) (Table S5).
HbA1c variability and outcomes
Increased HbA1c variability significantly increased the risk of adverse outcomes. The risk of MACEs and all-cause mortality in the high HbA1c variability group was nearly 2·5 (HR: 2·38, 95% confidence interval [CI]: 1·99 − 2·84, K-means) and 4 (HR: 3·76, 95% CI: 3·06 − 4·64, K-means) times higher than that in the low HbA1c variability group, respectively (Table S6). The relationship between either the HVS or the SD and MACEs could be presented as a J-shaped curve, and this relationship did not change with the intensity of the treatment (Figure S2). The results of GAM showed that as HVS and SD increase, the heightened risk brought about by intensive glucose management compared to standard glucose management became higher (Figure S3). Regarding hypoglycemic events, as the degree of variability increased, the incidence of hypoglycemic events significantly raised (Table S6).
HbA1c variability and intensive blood glucose treatment
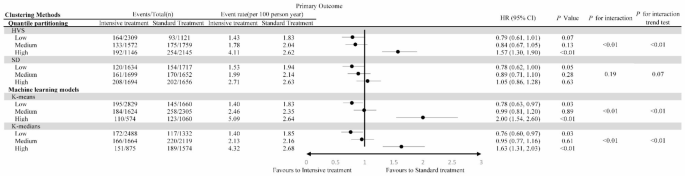
Participants were divided into six groups according to HbA1c variability and intensive treatment. The group with high HbA1c variability and intensive treatment had the highest risk of MACEs, while that with low variability and intensive treatment had the lowest risk (Figure S4). There was a significant interaction between intensive treatment and HbA1c variability grouping (P < 0·01, K-means and K-medians). Additionally, intensive treatment significantly reduced the risk of MACEs in the low HbA1c variability group (HR: 0·78, 95% CI: 0·63 − 0·97, K-means) but significantly increased the risk in the high variability group (HR: 2·00, 95% CI: 1·54 − 2·60, K-means) (Fig. 1). In the low variability group, intensive treatment primarily reduced the risk of non-fatal MI (HR: 0·73, 95% CI: 0·56 − 0·97, K-means) and non-fatal stroke (HR: 0·61, 95% CI: 0·36-1.04, K-means) (Table S7).
The primary outcome in participants randomized to the intensive compared with the standard blood glucose treatment group, stratified by HbA1c variability levels
For all-cause mortality, there was also a significant interaction between HbA1c variability and intensive treatment (P < 0·01, K-means and K-medians). Similarly, intensive treatment did not increase the mortality risk in the low HbA1c variability group (HR: 1·07, 95% CI: 0·81 − 1·42, K-means), but significantly increased the mortality risk in the high HbA1c variability group (HR: 2·20, 95% CI: 1·66 − 2·92, K-means) (Fig. 2).

The all-cause mortality in participants randomized to the intensive compared with the standard blood glucose treatment group, stratified by HbA1c variability levels
Regardless of the categorization by degree of variability, intensive treatment significantly increased the incidence of hypoglycemic events. However, as variability increases, the magnitude of risk enhancement correspondingly decreases (P for interaction trend test = 0.02, both K-means and K-medians, Table S8). In the low variability group, intensive treatment did not increase the incidence of non-hypoglycemic related SAE (Serious Adverse Events). However, in the medium and high variability groups, there was a significant increase in the incidence of non-hypoglycemic related SAE. Furthermore, in the standard treatment group, an increase in variability did not elevate the incidence of non-hypoglycemic related SAE. Yet, in the intensive treatment group, an increase in variability significantly raised the incidence of non-hypoglycemic related SAE (Figure S5).
Whether considering the risk of MACEs, all-cause mortality or the hypoglycemic events, as the variability grouping increases, the benefits of intensive management disappeared and instead significantly increased the risk. There was a dose-response relationship between variability grouping and the risk of intensive management (P for interaction trend test < 0.05, both K-means and K-medians, MACEs, all-cause mortality and hypoglycemic events) (Figs. 1 and 2, Table S8). This indicated that in different variability groupings, the change in mean HbA1c brought about different changes in risk.
The mean HbA1c value from all visits and the risk of outcomes in different k-means variability groups
Given that intensive glucose-lowering strategies demonstrated varying effects across different variability groups, to further ascertain the role of HbA1c variability in influencing the therapeutic efficacy of glucose-lowering in patients, we computed the mean HbA1c value for each patient during the follow-up period. Additionally, GAM was employed to elucidate the relationship between the outcomes’ risk and the average HbA1c values. We observed that overall, as the mean HbA1c value increased, the risk of MACEs consistently escalated. However, the risk for all-cause mortality exhibited a more complex curve (Fig. 3A, B).

Association between the mean HbA1c value from all visits and the risk of primary outcome and all-cause mortality. A & B: Among all participants. C & D: Comparison among different HbA1c variability groups. The solid red line represents the estimated hazard ratio, while the dotted blue line indicates the 95% confidence interval
In different variability groups, the influence of average HbA1c on the risk of MACEs varied substantially (Fig. 3C, Figure S6). As illustrated in the GAM, in the low variability group, the risk of MACEs significantly increased with the rise of the mean HbA1c (HR: 1·33, 95% CI: 1·14 − 1·56, P < 0·01). Moreover, the log-likelihood ratio test did not support a curved relationship (P for log-likelihood ratio test = 0·46) (Table 2). However, in the medium variability group, the risk remained unchanged with changes in the mean HbA1c value until reaching an inflection point (HR: 0·88, 95% CI: 0·67 − 1·15, P = 0·36); beyond this point (7·49% [7·34%, 7·65%]), the risk of MACEs increased with the rise of the mean HbA1c (HR: 1·38, 95% CI: 1·11 − 1·71, P < 0·01). In the high variability group, the average HbA1c had no significant impact on the MACEs’ risk, irrespective of the model used. Furthermore, the variability grouping exhibited a significant interaction effect with the relationship between the average HbA1c and the MACEs’ risk (P for interaction < 0·05).
The relationship between mean HbA1c and the risk of all-cause mortality varied across different variability groups (Fig. 3D, Figure S6). In the low variability group, the risk of all-cause mortality increased with the rise of the mean HbA1c (HR: 1·23, 95% CI: 1·01–1·51) P = 0·04), and the log-likelihood ratio test did not indicate a curvilinear relationship between them (P = 0·29). Intriguingly, within the medium variability group, the relationship between mean HbA1c and all-cause mortality risk exhibited a U-shaped curve (P for log-likelihood ratio test < 0·01). When the mean HbA1c was below the inflection point (7·44, 95%CI: 7·30 − 7·59), the mortality risk decreased with an increase in mean HbA1c (HR: 0·49, 95% CI: 0·36 − 0·69, P < 0·01). However, once the mean HbA1c surpassed this inflection point, its increase corresponded with a heightened mortality risk (HR: 1·57, 95% CI: 1·19 − 2·08, P < 0·01). Surprisingly, in the high variability cohort, when the mean HbA1c was below the inflection point (7·86, 95% CI: 7·66 − 8·06), there was a significant reduction in mortality risk with an increasing mean HbA1c (HR: 0·63, 95% CI: 0·42 − 0·95, P < 0·01). However, once the mean HbA1c exceeded this point, it no longer had a discernible impact on the mortality risk (HR: 1·01, 95% CI: 0·78 − 1·31, P = 0·11). A significant interaction was observed between variability grouping and the relationship between the mean HbA1c and the risk of all-cause mortality (P for interaction = 0.02). We also present the analysis for hypoglycemic events in Table S9.
Sensitivity analysis
Sensitivity analysis showed that our results remained robust after the exclusion of the MACEs that occurred in the first year of follow-up. HbA1c variability still interacted significantly with intensive treatment, and intensive treatment significantly reduced the risk of MACEs (HR: 0·74, 95% CI: 0·58 − 0·94, K-means) and did not increase the mortality risk (HR: 1·14, 95% CI: 0·84 − 1·54, K-means) in the low variability group (Table S10). After excluding these patients, the relationship between mean HbA1c and both MACE and all-cause mortality risk remained unchanged across the different variability groups (Table S11). To further validate the robustness of our results, we employed VIM as a substitute for SD. VIM was utilized to assess the variability of HbA1c in another secondary analysis of ACCORD study [20]. After clustering HVS and VIM using the K-means method, the findings, ranging from group sizes to the impact on risk of adverse outcomes, closely aligned with our main results (Table S12, S13).