
Cardiovascular
High triglyceride-glucose index predicts cardiovascular events in patients with coronary bifurcation lesions: a large-scale cohort study
Oct
Baseline characteristics stratified by the occurrence of the primary endpoint
A total of 4530 patients with coronary bifurcation lesions were included in final analysis (Fig. 1). the distribution of the TyG index was depicted in additional file 1: Fig. S1. Baseline characteristics of patients with and without CV events are shown in Table 1. Patients experiencing CV events tended to be older with higher prevalence of DM, MI histories, PAD, CKD and three-vessel disease than those not (all P < 0.05). Besides, there were higher levels of SBP, FBG, HbA1c, hsCRP, serum creatinine and lower levels of BMI and LVEF in the events group than in the non-events group (all P < 0.05).
Baseline characteristics stratified by the TyG index tertiles
Compared to patients with low TyG index, those with elevated TyG index were younger, more likely to be female, and had lower BMI (Table 2). In the group with increased TyG index, comorbidities including DM, hypertension, and CKD were more common. Levels of FBG, HbA1c, TC, TG, LDL-C, hsCRP, and creatine were all greater in the higher TyG group compared to the lower TyG group. Patients with higher TyG index were more likely to have three-vessel disease according to the angiographic features. Additionally, we discovered that individuals with high TyG index had a higher proportion of beta-blockers and anti-diabetic medications (all P < 0.05, Table 2).
Correlation between the TyG index and established risk factors
Pearson or spearman correlation analysis were used to assess the correlation between the TyG index and established risk factors (Table 3). The results showed that the TyG index was positively correlated with BMI, SBP, DBP, HbA1c, FBG, TC, TG, LDL-C, hsCRP and serum creatinine and negatively correlated with age, HDL-C and Lp(a) (all P < 0.05).
Association between the TyG index and CV events
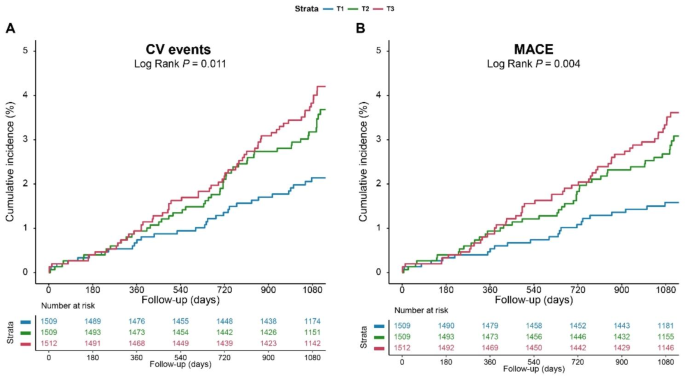
During a median follow-up of 3.1 years, 141 (3.1%) CV events and 117 (2.6%) MACEs were recorded. RCS plots discovered linear relationships between the TyG index and CV events and MACEs (both non-linear P > 0.05; additional file 1: Fig. 2). As shown in Fig. 2, KM curves showed that the cumulative incidence of both CV events and MACEs increased incrementally across the TyG index tertiles (both Log rank P < 0.05).
Kaplan-Meier curves for the TyG index and. CV events were defined as a composite of CV death, nonfatal MI, and non-fatal stroke. MACEs were defined as a composite of CV death and nonfatal MI. CV, cardiovascular; MACE, major adverse cardiac events; MI, myocardial infarction; TyG, triglyceride-glucose
Cox proportional regression analyses were implemented to evaluate the relationship between the TyG index and adverse clinical events (Table 4). In the univariable models, the risk of CV events (HR: 1.79, 95% CI: 1.37, 2.35; P < 0.001) or MACEs (HR: 1.85, 95% CI: 1.37, 2.49; P < 0.001) rose progressively with per 1-unit increase in the TyG index. And the associations remained significant after adjusting for age, sex, BMI, total cholesterol, LDL-C, hsCRP, creatine, LVEF, ACS, MI histories, hypertension, and three-vessel disease. When treated as a categorical variable, both second and highest tertiles of the TyG index (adjusted HR, 1.68; 95%CI, 1.06–2.65; P = 0.028; adjusted HR, 2.10; 95%CI, 1.28–3.47; P = 0.004, respectively) were associated with a higher risk of CV events compared to the low TyG group. A similar association was observed between the TyG index and MACEs.
To investigate the extra predictive value of the TyG index, we built an original model including age, sex, BMI, total cholesterol, LDL-C, hsCRP, creatine, LVEF, ACS, MI histories, hypertension, and three-vessel disease and got a C-statistic of 0.678 (95%CI, 0.634–0.722) for CV events. The C-statistic was greatly enhanced by the addition of the TyG index, increasing to 0.696 (95%CI, 0.651–0.741) (ΔC-statistic, 0.018; P < 0.001; NRI, 0.23; P = 0.007; IDI, 0.81%, P = 0.004) (Table 5). As for MACEs, the addition of the TyG index improved the C-statistic from 0.700 (95%CI, 0.650–0.750) to 0.713 (95%CI, 0.664–0.763) (ΔC-statistic, 0.013; P < 0.001; NRI, 0.25; P = 0.003; IDI, 0.61%; P = 0.010).
Subgroup analysis
As shown in Fig. 3 and additional file 1: Table S1, a higher TyG index was linked with a significantly increased risk of CV events whether the variable was considered as continuous (adjusted HR: 2.60, 95% CI: 1.69–4.02; P < 0.001) or categorical (T3 vs. T1, adjusted HR: 2.68, 95% CI: 1.17–6.11; P = 0.020) in patients with DM. whereas no significant association between the TyG index and CV events was observed in patients with NGT or prediabetes. The difference in the association between TyG index and CV events among patients with different glycemic statuses was not significant (P for interaction = 0.823). As for the secondary endpoint, diabetes patients with higher TyG index had a greater risk of MACE (adjusted HR: 2.21, 95% CI: 1.40, 3.48; P < 0.001). Furthermore, in the diabetes group, patients with high TyG index had a greater risk of MACE compared to patients with low TyG index (adjusted HR: 2.74, 95% CI: 1.12, 6.68; P = 0.899). The interaction effect of glycemic status and TyG index on MACE risk was not significant (P for interaction = 0.899).

Forest plot for the TyG index and CV events or MACE according to different glycemic status. Models adjusted for age, male sex, BMI, hypertension, diabetes mellitus, ACS presentation, MI histories, TC, LDL-C, hsCRP, serum creatinine, LVEF, and three-vessel disease. Blue dots indicate HR value and Bars indicate 95%CIs. CI, confidence intervanl; CV, cardiovascular; DM, diabetes mellitus; HR, hazard ratio; MACE, major adverse cardiac event; NGT, normal glucose tolerance; TyG, triglyceride-glucose
Furthermore, elevated TyG index levels were consistently related to CV events in patients with bifurcation lesion across various subgroups (Fig. 4 and additional file 1: Table S2, all P for interaction > 0.05).

TyG index in relation to CV events across different subgroups. Models adjusted for age, male sex, BMI, hypertension, diabetes mellitus, ACS presentation, MI histories, TC, LDL-C, hsCRP, serum creatinine, LVEF, and three-vessel disease