
Cancer and neoplasms
Human papillomavirus infections among women with cervical lesions and cervical cancer in Yueyang, China: a cross-sectional study of 3674 women from 2019 to 2022
HPV distribution characteristics in patients with cervical lesions
Of the 3674 patients with cervical lesions, 2744 were positive for HPV, giving a prevalence of 74.69% (95% CI 73.28–76.09%). The prevalence of HPV in CIN I, CIN II, CIN III, and ICC groups were 66.65% (1273/1910, 95% CI 64.53–68.77%), 80.78% (580/718, 95% CI 77.89–83.67%), 83.88% (483/576, 95% CI 80.84–86.87%), and 86.81% (408/470, 95% CI 83.74–89.88%), respectively. The total HPV prevalence in patients with precancerous cervical lesions was 72.91% (2336/3204, 95% CI 71.37–74.45%), which was lower than the total HPV prevalence in patients with CC (408/470, 86.81%, 95% CI 83.74–89.88%) (p < 0.001). The HPV prevalence was higher in patients with CIN II and III than in those with CIN I (p < 0.001). Furthermore, the prevalence increases with increasing disease severity.
The prevalence of HR-HPV and LR-HPV was 73.46% (2699/3674, 95% CI 72.03–74.89%) and 7.21% (265/3674, 95% CI 6.38–8.05%), respectively. The five most common HR-HPV genotypes were HPV 16 (22.92%, 95% CI 21.56–24.28%), 52 (20.14%, 95% CI 18.84–21.44%), 58 (14.59%, 95% CI 13.45–15.73%), 53 (6.78%, 95% CI 5.96–7.59%), and 51 (6.42%, 95% CI 5.63–7.22%), and the most common LR-HPV genotype was HPV 81 (3.13%), followed by HPV 42 (1.47%) and 43 (1.33%). The prevalence of HR-HPV was 65.08% (1243/1910, 95% CI 62.94–67.22%), 79.81% (573/718, 95% CI 76.86–82.75%), 83.51% (481/576, 95% CI 80.47–86.55%), and 85.53% (402/470, 95% CI 82.34–88.72%) in CIN I, CIN II, CIN III, and ICC groups, respectively, with high-risk HPV infection predominating in precancerous cervical lesions and CC.
HPV 16 (22.92%), 52 (20.14%), 58 (14.59%), 53 (6.78%), and 51 (6.42%) were the five most common HPV genotypes among patients with cervical lesions. The top five genotypes for each cervical lesion grade were HPV 52, 16, 58, 53, and 31 for CIN I; HPV 52, 16, 58, 51, and 53 for CIN II; HPV 16, 58, 52, 33, and 31 for CIN III; and 16, 58, 52, 18, and 33 for ICC. The prevalence of HPV16 was significantly higher in ICC than in CIN I, CIN II and CIN III (p < 0.001). The prevalence of in CIN I, CIN II, CIN III, and ICC groups was 12.57%, 20.89%, 36.98%, and 50.85%, respectively. The prevalence of HPV 18 was low in the CIN group but was the fourth highest in the ICC group. The detailed results are shown in Table 1 and Fig. 2.
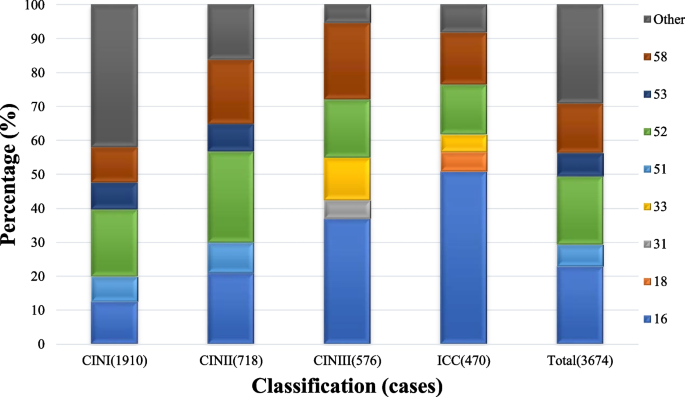
Distribution of HPV infection in different levels of cervical lesions among women in Yueyang. (HPV) 16, 18, 31, 33, 51, 52, 53, 58, Other (%)
Single and multiple HPV infections in different types of cervical lesions
Cervical lesions were dominated by a single HPV infection, with a prevalence of 48.50% (1782/3674, 95% CI 46.89–50.12%), followed by double and multiple HPV infections with a prevalence of 17.45% (641/3674, 95% CI 16.22–18.67%) and 8.74% (321/3674, 95% CI 7.82–9.65%), respectively. The most multiple infections were caused by nine genotypes. The CIN I, CIN II, CIN III and ICC groups were most commonly characterized by single infections, corresponding to single HPV prevalence rates of 42.20% (806/1910, 95% CI 39.98–44.42%), 49.16% (353/718, 95% CI 45.50–52.83%), 57.29% (330/576, 95% CI 53.24–61.34%) and 62.34% (293/470, 95% CI 57.94–66.74%), respectively. The prevalence of double HPV was 16.60% (317/1910, 95% CI 14.93–18.27%), 20.47% (147/718, 95% CI 17.52–23.43%), 17.88% (103/576, 95% CI 14.74–21.02%), and 15.74% (74/470, 95% CI 12.44–19.05%) in CIN I, CIN II, CIN III, and ICC groups, respectively, and the prevalence of triple and above HPV was 7.85% (150/1910), 11.14% (80/718), 8.68% (50/576), and 8.72% (41/470), respectively (Table 2).
HPV infection and genotype distribution in patients of different ages
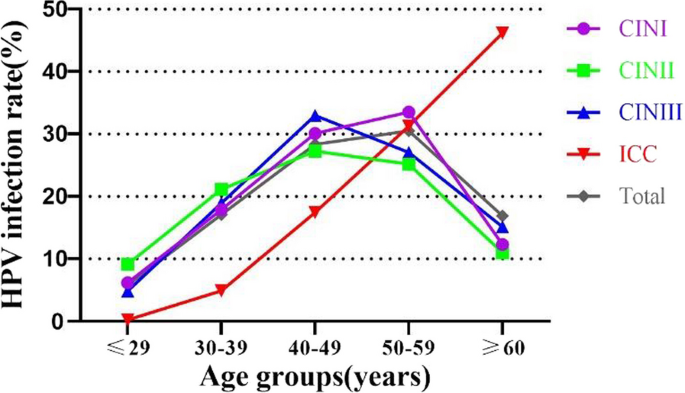
All patients were subdivided into five age groups: ≤ 29 years, 30–39 years, 40–49 years, 50–59 years, and ≥ 60 years. The age-stratified distribution of patients with CIN and ICC in Yueyang is shown in Table 3 and Fig. 3. The prevalence of HPV among the CIN I patients was the highest in the 50–59 years age group (33.51%, 640/1910, 95% CI 31.39–35.63%), which was higher HPV prevalence than the same age group of patients in CIN II, CIN III, and ICC groups. Among patients with CIN II and CIN III, the highest HPV prevalence was found in the age group of 40–49 years (29.11% [209/718, 95% CI 25.78–32.44%]and 32.99% [190/576, 95% CI 29.14–36.84%], respectively), followed by the age group of 50–59 years. In the ICC group, the prevalence gradually increased with age, reaching 46.17% (217/470, 95% CI 41.65–50.69%) in the ≥ 60 years age group (p < 0.001) (Table 3, Fig. 4).

Age stratified distribution of patients with CIN and ICC in Yueyang. ICC, CINIII, CINII, CINI, Total (%)
Prevalence of HPV infection in patients with cervical lesions of different age strata in Yueyang
The five most common genotypes of HPV infection among patients with cervical lesions in different age groups are detailed in Table 4. Among patients with CINI, the five most common genotypes of HPV infection in the age group of 50–59 years were HPV 52 (5.81%), 16 (3.93%), 58 (3.66%), 53 (3.04%) and 51 (2.62%). Among CIN II patients, the most common genotypes of HPV infection in the age group 40–49 years were HPV 52 (7.94%), 16 (5.99%), 58 (4.04%), 18 and 51 (1.95%) and 31 (1.39%). Among patients with CIN III, the five most common genotypes of HPV infection in the age group 40–49 years were HPV 16 (11.81%), 58 (7.12%), 52 (4.86%), 33 (3.82%) and 31 (1.56%). Among the ICC patients, the five most common genotypes of HPV infection in the ≥ 60 years age group were HPV 16 (22.13%), 58 (9.36%), 52 (8.51%), 53 (2.98%), and 51 (2.77%).
In the CIN I group, HPV 52 was the most common genotype across all age groups, followed by HPV 16, which ranked fourth except in the ≥ 60 years age group. In the CIN II group, HPV 52 and HPV 16 were the two most common genotypes in patients under the age of 60 years, and in the CIN III group, HPV 16 was the most common genotype in nearly all age groups, ranking second only in the ≥ 60 years age group. In the ICC group, HPV 16 was the most common genotype across all age groups.