
Infection
Analysis of respiratory virus detection in hospitalized children with acute respiratory infection during the COVID-19 pandemic
General clinical features
Among the cohort of 9782 children diagnosed with ARIs, 5021 cases (51.3%) were identified prior to the onset of the COVID-19 pandemic (2018–2019), while 4761 cases (48.7%) were diagnosed during the pandemic period (2020–2022). Compared with the pre-COVID, the proportion of children aged 0 ~ < 1 years on ARIs was lower during the COVID-19 pandemic (p < 0.05). Gender distribution exhibited no significant variation between the two periods (p > 0.05), as indicated in Table 1.
Between 2018 and 2022, the yearly counts of ARIs cases were 2356, 2665, 1092, 1681, and 1988, with the lowest number of inpatient ARIs cases in 2020. The annual percentage of positive cases was 12.99%, 19.32%, 20.32%, 19.45%, and 12.68%, as presented in Table S1. Indeed, the Chinese government implemented prompt and stringent epidemic prevention measures starting in January 2020, including home isolation and mask mandates. From December 2021, children above the age of 3 (except those with specific contraindications) received SARS-CoV-2 vaccinations in Shaoxing. The positive rate of respiratory viruses among children over 3 years old was 8.31% (52/626) in 2022 and 7.61% (29/381) in 2021. Importantly, the detection rate of common respiratory viruses did not exhibit a significant decrease after the introduction of the new coronavirus vaccination (P = 0.69).
Overall detection of respiratory viruses
The identification of one or more viruses was observed in 16.35% (n = 821/5021) of samples prior to COVID-19 and 17.06% (n = 812/4761) during the pandemic, as detailed in Table 1. The cumulative detection rate of respiratory viruses experienced a decline from January to April and increased from October to December during both study periods (Fig. 1A).
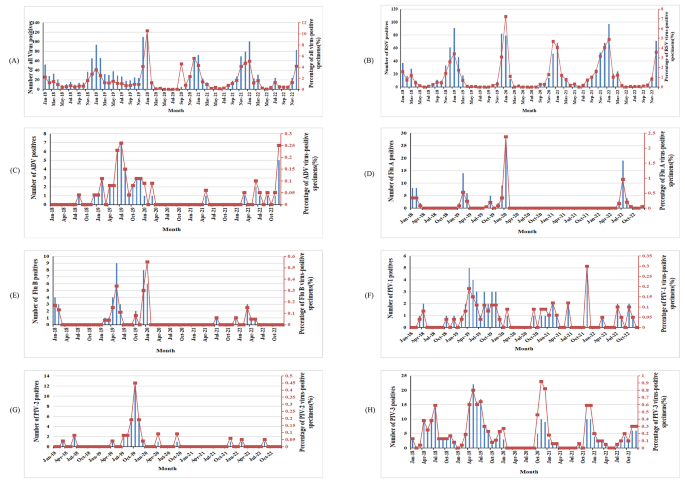
Positive cases and infection rates of respiratory viruses among hospitalized children with ARIs from 2018 to 2022. A: Total positive cases and infection rates for all respiratory viruses. B: Positive cases and infection rates of RSV. C: Positive cases and infection rates of ADV. D: Positive cases and infection rates of Flu (A) E: Positive cases and infection rates of Flu (B) F: Positive cases and infection rates of PIV-1. G: Positive cases and infection rates of PIV-2. H: Positive cases and infection rates of PIV-3.
RSV emerged as the predominant virus prior to and during COVID-19, accounting for 50.79% of positive samples in 2018–2019 and 76.48% in 2020–2022. Notably, the RSV positive rate during 2020–2022 exhibited a more significant increase than in 2018–2019 (13.04% vs. 9.38%, p < 0.05). Conversely, the positive rates of ADV, PIV2 and 3, and Flu B experienced more significant reductions during 2020–2022 compared to 2018–2019 (p < 0.05), while the positive rates for Flu A and PIV1 exhibited no significant differences between the two periods (p > 0.05) (Table 1).
The temporal distribution of infections and positive rates is depicted in Fig. 1B, wherein RSV infections and positive rates displayed seasonal fluctuations annually between September and May from 2018 to 2019, 2020 to 2021, and 2021 to 2022. A notable surge occurred from December 2019 to January 2020. ADV infections and positive rates exhibited seasonal fluctuations between January 2019 and January 2020, with a sharp decline between April 2020 and January 2022. Flu A infections and positive rates remained low between April 2020 and April 2022, with a modest increase observed in children during the COVID-19 recovery phase from May 2022 to September 2022. Flu B infections and positive rates were low between April 2020 and April 2021, with a subsequent modest increase after July 2021, although remaining lower compared to the same period prior to the COVID-19 outbreak. Notably, PIV1, PIV2, and PIV3 infections declined after January 2020 (Fig. 1C H).
A total of 11 samples yielded positive results for two viruses, with 6 instances prior to COVID-19 and 5 during the pandemic (0.12% vs. 0.10%, p > 0.05). Throughout COVID-19, the most prevalent mixed infection was ADV in conjunction with PIV3, accounting for 25.71% of mixed infection cases. Nevertheless, cases of more than two concurrent virus detections were not observed during the two study periods.
Comparison of the age distribution of respiratory viruses
Patients were classified into four age groups. Table 2 illustrates the detection rates of respiratory viruses in different age groups. Prior to and during COVID-19, the overall positive rate peaked at 19.94% and 23.15%, respectively, within the 1–12 month age group. These rates exhibited a descending trend with increasing age of the enrolled children. Compared to the period before COVID-19, the total positive rates within the 0–12 month age group were significantly higher during the pandemic (p < 0.05), while significant differences were not noted in other age groups (Table S1).
The dominant viruses varied across the different age groups. Before and during COVID-19, although all seven viruses were not detected in each age group, RSV remained the most prevalent among those under 7 years. In 2018–2019, PIV-3 was the second most dominant virus in the < 3 years age group, while ADV held this position in the 3–7 years age group. In 2020–2022, PIV-3 was the second most dominant virus in the < 1 year age group, while Flu A took this place in the 1–7 years age group. Notably, the RSV detection rate among different age groups was higher in 2020–2022 than in 2018–2019, especially among infants (p < 0.001).
The seasonal distribution of respiratory viruses
Table 3 provides an overview of the positive sample detection for each virus across different months before and during COVID-19. In general, the prevalence of respiratory viruses demonstrated higher rates during winter compared to other seasons, with total positive rates of 30.90% and 33.24% before COVID-19 and during the pandemic, respectively. In contrast to the equivalent period preceding COVID-19, the total positive rates during winter in the COVID-19 era exhibited no significant difference (p > 0.05). During 2020–2022, the total positive rates during spring and summer seasons significantly decreased (p < 0.05), increased significantly in autumn (p < 0.05).
Figure 2 further illustrates that both before and during COVID-19, the RSV-positive rate during winter was notably higher than in other seasons (p < 0.05). During COVID-19, Flu A exhibited a higher positive rate (2.61%) in summer, contrasting with the higher rate (3.05%) in winter before the pandemic. Conversely, the PIV3 positive rate during the summer of the pandemic (0.3%) was lower than that during the same period before COVID-19 (5.76%).
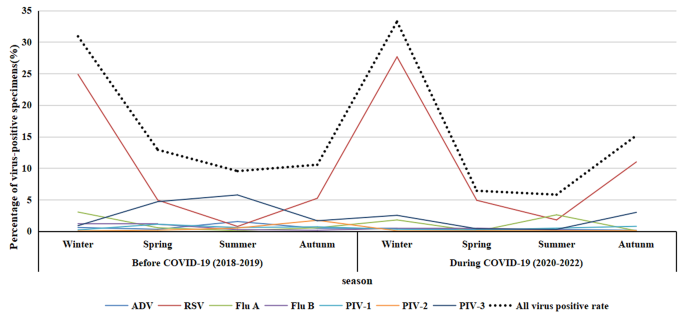
Seasonal distribution trends of respiratory virus infection in hospitalized children with acute respiratory infection, 2018–2019 and 2020–2022