
Cardiovascular
Association of obesity with cardiovascular disease in the absence of traditional risk factors
Nov
Abstract
Background
The association between obesity and cardiovascular disease (CVD) in people without traditional CVD risk factors is unclear. This study aimed to investigate the association of obesity with CVD and its subtypes in people without traditional CVD risk factors.
Methods
Based on the Kailuan cohort study, the included participants were divided into different groups according to levels of body mass index (BMI) and waist height ratio (WHtR), respectively. Multivariate Cox proportional hazard models were used to evaluate the associations.
Results
This study included 31,955 participants [men 63.99%; mean age (48.14 ± 3.33) years]. During a median follow-up period of 12.97 (interquartile range: 12.68–13.17) years, 1298 cases of CVD were observed. Compared with the normal BMI group, the hazard ratios (HRs) for CVD, stroke, and myocardial infarction (MI) in the BMI obese group were 1.31 (95% confidence interval [CI] 1.11–1.55), 1.21 (95%CI 1.01–1.46), 1.62 (95%CI 1.13–2.33), respectively. Compared with the WHtR non-obese group, the HRs for CVD, stroke, and MI in the obese group were 1.25(95%CI 1.11–1.41), 1.18 (95%CI 1.03–1.34), 1.57 (95%CI 1.18–2.09), respectively. There was an interaction between age and WHtR (P for interaction was 0.043). The association between WHtR and CVD was stronger in people under 60 years old, with a HR of 1.44 (95%CI 1.24–1.67).
Conclusion
We found that obesity increased the risk of CVD in people without traditional CVD risk factors. The association of WHtR with CVD was stronger in people under 60 years old.
Introduction
Cardiovascular disease (CVD) is a leading cause of disability and death, with the total number of CVD deaths increasing by a quarter globally since 2000, reaching 17.9 million in 2019 [1]. According to the National Cholesterol Education Program Adult Treatment Group III, people without traditional CVD risk factors were defined as people without dyslipidemia, hypertension, diabetes and smoking by Fernández-FrieraL et al. [2]. Previous studies have indicated that individuals without traditional CVD risk factors are still susceptible to a higher risk of CVD development [2,3,4,5,6,7]. However, little attention has been paid to the association between obesity and CVD in people without traditional CVD risk factors, and further studies are needed.
Obesity can be divided into overall obesity and abdominal obesity [8]. Currently, body mass index (BMI) is commonly accepted as a measure of overall obesity. Relevant studies have shown that BMI is associated with increased risk of CVD [9, 10]. In addition, a large number of studies have found that waist height ratio (WHtR), an comprehensive indicator for abdominal obesity, is a better predictor of CVD than waist circumference, and waist-hip ratio [11,12,13,14]. However, the results of previous studies have shown inconsistent associations between BMI, WHtR and CVD in different population [15,16,17,18,19,20,21], and these prior studies did not report the association between obesity and CVD among participants without traditional CVD risk factors. Addressing this question will help to determine whether the obesity is an independent risk factor of CVD and whether population prevention strategies may be important for healthy individuals without traditional CVD risk factors based on current definitions.
Therefore, the aim of this study was to assess whether overall obesity assessed by BMI and abdominal obesity assessed by WHtR were associated with the risk of CVD and its subtypes among people without traditional risk factors in the population-based cohort of Kailuan Study.
Methods
Study design and participants
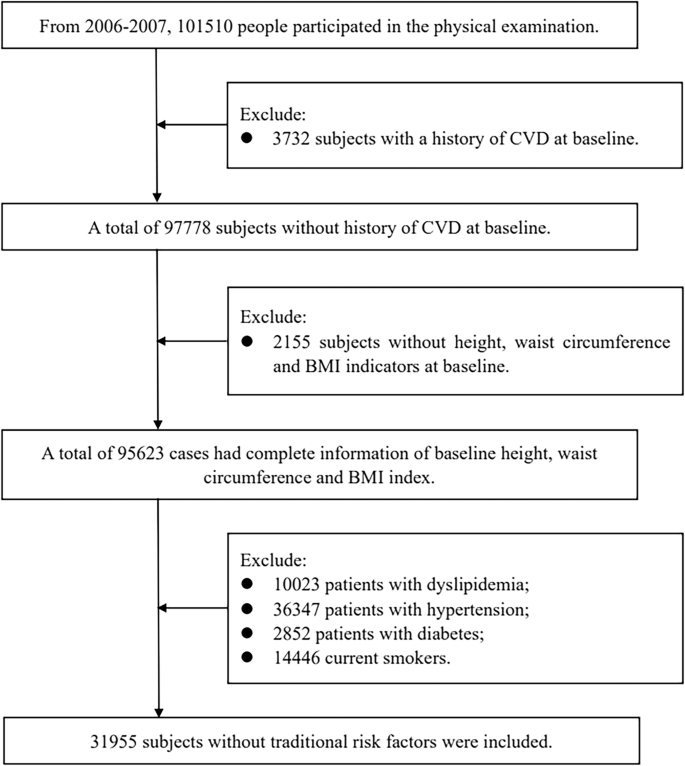
The Kailuan Study is a prospective cohort study conducted in the Kailuan community of Tangshan, China. The details of study design have been described previously [22,23,24]. In briefly, from June 2006 to October 2007, the Kailuan cohort study recruited 101510 employees and retirees (81,110 men and 20,400 women; between the ages of 18–98 years) of the Kailuan (Group) Co. Ltd, a large coal mine industry located in Tangshan, Hebei Province. For the analysis of the association of overall obesity assessed by BMI and abdominal obesity assessed by WHtR with CVD in the absence of traditional CVD risk factors, we first excluded 3732 participants with a history of CVD and 2155 participants without height, waist circumference, and BMI indicators at baseline. Then, we further excluded 63,668 participants with atherosclerotic (ASCVD) risk factors, which was defined based on traditional categorical ASCVD risk factors that are included in the 2013 pooled cohort equations, the 2018 American Heart Association/American College of Cardiology Guideline on the Management of Blood Cholesterol, and the 2019 Guideline on the Primary Prevention of Cardiovascular Disease [2, 25,26,27]. To be more specific, we further excluded 10,023 participants with dyslipidemia (low density lipoprotein cholesterol [LDL-C] level ≥160 mg/dL, high density lipoprotein cholesterol [HDL-C] level <40 mg/dL, or reported use of a cholesterol-lowering medication), 36,347 participants with hypertension (systolic blood pressure [SBP] level ≥140 mmHg, diastolic blood pressure [DBP] level ≥90 mmHg, or were used antihypertension medication), 2852 participants with diabetes (fasting blood glucose [FBG] ≥ 7.0 mmol/L, or were used hypoglycemic medication), and 14,446 currently using tobacco products. After applying these exclusion criteria, 31,955 participants were finally included in the current analysis (Fig. 1).
CVD cardiovascular disease, BMI body mass index.
The study has completed seven circles of health assessments, including health assessments in 2006–2007, 2008–2009, 2010–2011, 2012–2013, 2014–2015, 2016–2017, and 2018–2019. According to standardized uniform design, face-to-face questionnaire interviews (demographic characteristics, disease history, lifestyles, etc.), physical examinations (body weight, height, waist circumference, blood pressure, etc.), and laboratory tests (fasting blood glucose, lipids profile, etc.) were conducted by trained physicians or nurses in every circle. The study was performed according to the guidelines of the Declaration of Helsinki and was approved by the Ethics Committee of Kailuan General Hospital and Beijing Tiantan Hospital. All participants provided written informed consent.
Data collection
In the Kailuan Study, information on participants’ demographic characteristics, lifestyle habits (including smoking, drinking status and physical exercise), disease history, and medication history were collected through questionnaires. Anthropometric measurements included height, weight, BMI, and waist circumference, with waist circumference and height accurate to 0.1 cm and weight accurate to 0.1 kg. BMI was calculated as weight in kilograms divided by the square of the height in meters. WHtR was calculated as waist circumference in centimeters divided by height in centimeters.
Blood pressure was measured with a manual sphygmomanometer or an electronic blood pressure meter (HEM-8102A; Omron Limited, Dalian, China) after the participants rested for ≥5 min. Blood samples were collected from the anterior elbow vein early in the morning after an overnight fast (8–12 h) and were analyzed in the central laboratory of Kailuan Hospital using an automated analyzer (Hitachi 747; Hitachi, Tokyo, Japan). FBG levels were measured by the hexokinase/glucose-6-phosphate dehydrogenase method with a coefficient of variation <2.0%. Serum total cholesterol (TC), triglycerides (TG), LDL-C and HDL-C levels were measured by enzymatic colorimetric method [6].
Outcome ascertainment
The primary outcome of this study was CVD, including stroke and myocardial infarction (MI). To retrieve potential CVD events, this study combined all medical records from municipal social insurance and hospital discharge records to collect event occurrences and perform centralized interpretation. Stroke was determined based on clinical symptoms, images obtained by computed tomography or magnetic resonance imaging, and other diagnostic reports according to World Health Organization criteria [28]. MI was determined based on myocardial enzyme levels, symptoms, electrocardiographic signs, and autopsy reports [29].
Statistical analyses
Overall obesity was assessed using BMI. The enrolled population were divided into 4 groups according to BMI levels, namely low weight (BMI < 18.5 kg/m2), normal (18.5 kg/m2 ≤ BMI < 24 kg/m2), overweight (24 kg/m2 ≤ BMI < 28 kg/m2), and obese (BMI ≥ 28 kg/m2). Abdominal obesity was assessed using WHtR. The enrolled population were divided into 2 groups according to WHtR levels, namely non-obese (WHtR < 0.5) and obese (WHtR ≥ 0.5). Statistical descriptions were expressed as mean ± standard deviation (SD) or median [interquartile range (IQR)], or frequencies and percentage. Continuous variables were compared using analysis of variance or the Kruskal-Wallis test according to distribution, and categoric variables were compared with the chi-square test.
We calculated the incidence rate of CVD, stroke, and MI per 1000 person-years with 95% confidence interval (CI). We also performed progressively adjusted Cox proportional hazards regression to examine the risk of BMI and WHtR for CVD, stroke, and MI. The normal BMI group and the WHtR non-obese group were defined as references, respectively. Model 1 adjusted for age and sex. Even though those with traditional risk factors have been excluded, to control for residual risk related to risk factors, model 2 additionally included drinking status, education, income, physical activity, SBP, DBP, FBG, TC level, and LDL-C level at baseline. P-values for trend test were calculated using BMI and WHtR as continuous variables to determine the significance of trends at different BMI, WHtR levels on clinical outcomes.
To further examine the relationship between BMI and WHtR levels and CVD, we performed a restricted cubic spline with 5 knots (at the 5th, 25th, 50th, 75th, and 95th percentiles) and tested for nonlinearity. This restricted cubic spline was adjusted for variables in Model 2.
To test the robustness of our findings, we performed several sensitivity analyses. Participants who did not meet the predefined categorical cut points but had risk factor values above what are typically defined as normal on a continuous scale were excluded: (1) LDL-C ≥ 130 mg/dL; (2) SBP ≥ 130 mmHg or DBP ≥ 80 mmHg; and (3) women with HDL-C < 50 mg/dL. In addition, stratified analyses by sex and age (<60 years; ≥60 years) were performed.
Statistical analyses were performed using SAS version 9.4 (SAS Institute Inc., Cary, NC, USA), and two-sided test of P < 0.05 was considered statistically significant.
Results
Baseline characteristics
A total of 31,955 participants [men 63.99%; mean age (48.14 ± 3.33) years] were eventually analyzed in our study. The average level of BMI was (24.21 ± 3.33) kg/m2. The average WHtR level was (0.51 ± 0.06). There were significant differences in age, sex, education, physical exercise, drinking, SBP, DBP, FBG, TC, TG, HDL-C and LDL-C among different BMI level groups. Compared with participants in the BMI normal group, those in the overweight and obese groups were more likely to be older, men, have a lower self-reported education, HDL-C, and have a higher level of SBP, DBP, FBG, TC, TG, and LDL-C. But there was no significant difference in income. There were significant differences in age, sex, education level, income, physical exercise, drinking, SBP, DBP, FBG, TC, TG, HDL-C, and LDL-C among different WHtR level groups. Compared with participants with WHtR non-obese group, the obese group with higher WHtR level was more likely to be older, men, have a lower self-reported education, income, drinking, LDL-C, HDL-C, and have a higher level of physical activity, SBP, DBP, FBG, TC and TG (Table 1).
The relationships between BMI, WHtR and CVD
During a median follow-up of 12.97 (interquartile range: 12.68–13.17) years, 1298 cases of CVD, including 1066 strokes and 245 MI, were observed in this study.
Association between BMI and CVD
The incidence of CVD events per 1000 person-years also increased with increasing BMI levels, ranging from 2.17 (95%CI 1.44–3.27) in the low weight group to 3.99 (95%CI 3.47–4.59) in the obese group. After adjusting for other confounders, the results of the multifactorial Cox regression analysis showed that the HRs for CVD were 0.73 (95%CI 0.48–1.11), 1.10 (95%CI 0.98–1.25), and 1.30 (95%CI 1.10–1.53) in the low weight group, overweight group, and obesity group, respectively, compared with the normal BMI group (Table 2). Multivariate adjusted restricted cubic spline regression models showed that the risk of CVD increased with increasing BMI levels and a linear relationship between BMI and CVD incidence (Pnon-linearity = 0.312) (Fig. 2).

Adjusted for age, sex, education, income, drinking status, physical activity, systolic blood pressure, diastolic blood pressure, fasting blood glucose, total cholesterol level, and low-density lipoprotein cholesterol level at baseline.
In the subtype analysis of CVD, similar results were found when stroke and MI were used as endpoint events. Compared with the normal BMI group, the HRs for strokes were 0.81 (95%CI 0.52–1.26), 1.10 (95%CI 0.96–1.25) and 1.21 (95%CI 1.01–1.46) for those in the low weight group, overweight group and obese group, respectively; the HRs for MI were 0.50 (95%CI 0.16–1.59), 1.11 (95%CI 0.84–1.47), and 1.62 (95%CI 1.13–2.33), respectively (Table 2). Multivariate adjusted restricted cubic spline regression models showed a linear association between BMI with stroke (Pnon-linearity = 0.242) and MI incidence (Pnon-linearity = 0.412) (Fig. 2).
After excluding participants with LDL-C ≥ 130 mg/dL (n = 1 958), excluding participants with SBP ≥ 130 mmHg or DBP ≥ 80 mmHg (n = 17 304), excluding women with HDL-C < 50 mg/dL (n = 1 954), the results of sensitivity analyses were similar to those of the primary analyses. (Table S1).
In addition, we also performed stratified analyses according to sex and age. We found no significant interactions between sex, age and BMI (P for interactionå 0.05) (Table S2 and Fig. S1).
Association between WHtR and CVD
The incidence of CVD events per 1000 person-years increased with the increase of WHtR levels, ranging from 2.25 (95%CI 2.05–2.48) in the non-obese group to 4.11 (95%CI 3.85–4.39) in the obese group. After adjusting for other confounding factors, compared with the non-obese group, the HR for CVD in the obese group was 1.25 (95%CI 1.11–1.40) (Table 3). The multivariate adjusted restricted cubic spline regression model showed that the risk of CVD increased with the increase of WHtR levels and a linear relationship between WHtR and CVD incidence (Pnon-linearity = 0.272) (Fig. 2).
In the subtype analysis of CVD, similar results were found when stroke and MI were used as endpoint events. The HRs of stroke and MI endpoint events increased with the increase of WHtR levels. Compared with the non-obese group, the HR for stroke in obese group was 1.18 (95%CI 1.03–1.34), and the HR for MI was 1.57 (95%CI 1.18–2.09) (Table 3). Multivariate adjusted restricted cubic spline regression models showed a linear association between WHtR with stroke (Pnon-linearity = 0.452) and MI incidence (Pnon-linearity = 0.119) (Fig. 2).
The sensitivity analyses results were similar to those of the preliminary analyses (Table S3).
Age stratified analyses showed that the relationships between WHtR and CVD (P for interaction was 0.043) and stroke (P for interaction was 0.021) were stronger in people under 60 years old, with HRs 1.44 (95%CI 1.24–1.67) and 1.37 (95%CI 1.17–1.62) respectively. Sex stratification analysis found no significant interactions between sex and WHtR (P for interactionå 0.05) (Table S4 and Fig. S2).
Discussion
Based on the Kailuan Cohort Study, this study found that the cumulative incidence of CVD increased with increased BMI and WHtR levels in people without traditional CVD risk factors. After adjusting for confounding factors, BMI and WHtR were associated with increased risk of CVD, stroke and MI and their association is linear. Furthermore, the association between WHtR and CVD was stronger in people under 60 years old. These results suggested that BMI and WHtR were important influencing factors of CVD in people without traditional risk factors.
The association between overall obesity assessed by BMI and CVD is not consistent in different populations. We found a linear association between BMI with CVD incidence. Similar to the results of our study, a large cohort study including participants without hypertension, diabetes or dyslipidemia found that BMI increased the risk of CVD [15]. Similarly, after limiting three traditional risk factors (hypertension, diabetes and dyslipidemia) of CVD, a meta-analysis also reached a conclusion that the risk of CVD increased with an elevated level of BMI [16]. A meta analysis showed that BMI may have a positive linear association with risk of CVD incidence in individuals with type 2 diabetes mellitus [30]. When excluding smokers and those with preexisting disease (e.g. cancer), Iliodromiti S et al. found a linear association between BMI and CVD [31]. However, according to follow-up study of middle-aged Finns, Käräjämäki AJ et al. [17] found that obese subjects had no increased risk of CVD compared with those with normal weight in people without hypertension, diabetes or dyslipidemia. It should be noted that the sample size of this study was very small and the generalization of the results was limited. In addition, two meta-analyses also found that obesity was not associated with the risk of CVD in this population [18, 19]. However, most of the people in these two studies are foreign people, and there is population heterogeneity. In addition, publication bias must be considered. Additionally, Bae JC et al. revealed a J-shaped association between BMI and incident CVD events [32]. Differences with our results, a meta-analysis found there was an increased risk of CVD in overweight group compared with normal weight group (relative risk: 1.34, 95%CI: 1.23–1.46, I2 = 90.3%) after limiting hypertension, diabetes and dyslipidemia; however, heterogeneity was high among different studies [16]. Previous study showed that women with overweight had an increased CVD risk compared with normal weight (HR: 1.20, 95%CI: 1.04–1.39) [33]. But the study population mainly consisted of women from European ancestry, and there is population heterogeneity. Compared with the above studies, smoking, an important traditional risk factor, also was considered in our study.
The relationship between abdominal obesity assessed by WHtR and CVD is not consistent in different populations. We found a linear relationship between WHtR and CVD incidence. Similar to our results, Xue R et al. found that WHtR increased the risk of CVD [34] and a European study showed a linear association between WHtR and CVD [31]. In addition, Rådholm K et al. [20] used WHtR to predict cardiovascular risk in patients with diabetes and found that WHtR was positively correlated with adverse outcomes of cardiovascular disease, without sex or regional heterogeneity. But different from our study, their result showed that WHtR had a stronger impact on individuals aged 66 or above. The reason for the inconsistency may be that the participants in their study were 55 years or older at high risk of a cardiovascular event. However, a dose–response meta-analysis of thirty-one prospective studies showed a non-linear relationship between WHtR and risk of CVD in men and women and when WHtR over 0.5, the risk of CVD would rise sharply both in men and women [34]. Moreover, Khalili S et al. [21] followed up adult diabetic patients for 8.4 years and found that WHtR could not predict the risk of CVD in this population. The reason for the inconsistency of the results may be due to small sample size.
Our results showed that overall obesity and abdominal obesity were risk factors for CVD even in participants without traditional CVD risk factors, which further emphasized the important role of BMI and WHtR levels in the development of CVD. The results suggested that in addition to pay close attention to people with traditional CVD risk factors, attention should also be paid to the primary prevention of BMI and WHtR levels in people without traditional CVD risk factors, so as to provide more accurate strategies for the prevention and control of CVD.
Our findings are biologically plausible. Studies have shown that obesity may be the cause of heart failure with preserved ejection fraction, which includes cellular hypertrophy, left ventricular diastolic dysfunction and increased extracellular collagen deposition, thus increasing myocardial fibrosis [35]. Obesity is associated with chronic inflammation that persists in visceral adipose tissue. In this regard, adipose tissue inflammation and oxidative stress lead to reduced production of adiponectin and increased secretion of resistin, leptin and pro-inflammatory adipokines and cytokines, resulting in cardiovascular stiffness, vascular relaxation and eventually cardiac diastolic dysfunction. In addition, obesity can activate the renin-angiotensin- aldosterone system (RAAS). Under pathophysiological conditions, RAAS can stimulate inflammation and structural remodeling, leading to heart and vascular damage [36].
The advantage of this study was that it selected people without traditional risk factors to directly analyze the relationship between obesity and CVD. In addition, comprehensive analysis of the relationship between obesity and CVD by overall obesity and abdominal obesity, respectively. Finally, this study has a long follow-up time and detailed information about covariates. Despite these advantages, some limitations of this study should be taken into account. First, in this study, the participants are limited to the Tangshan community in China, so the generalizability of the results are limited. Second, because participants were mostly coal miners, females were still underrepresented and there were twice as many individuals who had traditional risk factors compared to those who did not in this cohort so that the generalizability of the results are limited. We performed sex stratification analyses and the results showed that there were no significant interactions between sex and BMI, WHtR. Third, it is possible that the clinical cut points used for traditional risk factors are too high, meaning that there is risk, even at a level not previously considered clinically important, but in the borderline range. We excluded participants who did not meet the predefined categorical cut points but had risk factor values above what are typically defined as normal on a continuous scale and performed sensitivity analyses. The results were similar to those of the primary analyses. Fourth, we did not evaluate additional nonmodifiable risk factors (e.g., second-hand smoking or air pollution) and did not explore the potential roles of diet and physical activity in greater detail because this was not the focus of this study. Finally, the strength of a causal association depends on the relative prevalence of other component causes for the same disease. Weak associations may sometimes be strengthened by restricting attention to people at low risk [37]. We removed the effect of ‘traditional’ CVD risk factors. This would be expected to result in lower levels of CVD, but also removing important risk factors would tend to reduce absolute risks but increase relative risks of BMI and WHtR.
Conclusions
This study found that in people without traditional CVD risk factors, obesity increased the risk of CVD. There was an interaction between age and WHtR, and the association between WHtR and CVD was stronger in people under 60 years old. Our study suggests that BMI and WHtR are important influencing factors of CVD even in individuals without traditional risk factors.
Data availability
Some or all datasets generated during and/or analyzed during the current study are not publicly available but are available from the corresponding author on reasonable request.
References
-
World Health O. World health statistics 2021: monitoring health for the SDGs, sustainable development goals, World Health Organization: Geneva, 2021
-
Fernandez-Friera L, Fuster V, Lopez-Melgar B, Oliva B, Garcia-Ruiz JM, Mendiguren J, et al. Normal LDL-Cholesterol Levels Are Associated With Subclinical Atherosclerosis in the Absence of Risk Factors. J Am Coll Cardiol. 2017;70:2979–91.
Google Scholar
-
Silverman MG, Blaha MJ, Krumholz HM, Budoff MJ, Blankstein R, Sibley CT, et al. Impact of coronary artery calcium on coronary heart disease events in individuals at the extremes of traditional risk factor burden: the Multi-Ethnic Study of Atherosclerosis. Eur Heart J. 2014;35:2232–41.
Google Scholar
-
Whelton SP, McEvoy JW, Shaw L, Psaty BM, Lima JAC, Budoff M, et al. Association of Normal Systolic Blood Pressure Level With Cardiovascular Disease in the Absence of Risk Factors. Jama Cardiol. 2020;5:1011–8.
Google Scholar
-
Won KB, Park GM, Yang YJ, Ann SH, Kim YG, Yang DH, et al. Independent role of low-density lipoprotein cholesterol in subclinical coronary atherosclerosis in the absence of traditional cardiovascular risk factors. Eur Heart J Cardiovasc Imaging. 2019;20:866–72.
Google Scholar
-
Zuo Y, Han X, Tian X, Chen S, Wu S, Wang A. Association of Impaired Fasting Glucose With Cardiovascular Disease in the Absence of Risk Factor. J Clin Endocrinol Metab. 2022;107:e1710–e1718.
Google Scholar
-
Zheng R, Xu Y, Li M, Lu J, Wu S, Niu J et al. Examining the Linear Association Between Blood Pressure Levels and Cardiovascular Diseases in the Absence of Major Risk Factors in China. Circ Cardiovasc Qual Outcomes. 2022: 101161CIRCOUTCOMES121008774
-
Thomas R, Ambookan PV, Jose J, Unnikrishnan UG. The accuracy of anthropometric measurements of general and central obesity for the prediction of impaired glucose tolerance among the adult population of South India. J Family Med Prim Care. 2020;9:3416–20.
Google Scholar
-
Hansen L, Netterstrom MK, Johansen NB, Ronn PF, Vistisen D, Husemoen LLN, et al. Metabolically Healthy Obesity and Ischemic Heart Disease: A 10-Year Follow-Up of the Inter99 Study. J Clin Endocrinol Metab. 2017;102:1934–42.
Google Scholar
-
Matsunaga M, Yatsuya H, Iso H, Li Y, Yamagishi K, Tanabe N, et al. Impact of Body Mass Index on Obesity-Related Cancer and Cardiovascular Disease Mortality; The Japan Collaborative Cohort Study. J Atheroscler Thromb. 2022;29:1547–62.
Google Scholar
-
Pasdar Y, Moradi S, Moludi J, Saiedi S, Moradinazar M, Hamzeh B, et al. Waist-to-height ratio is a better discriminator of cardiovascular disease than other anthropometric indicators in Kurdish adults. Sci Rep-UK. 2020;10:16228.
Google Scholar
-
Song X, Jousilahti P, Stehouwer CDA, Soderberg S, Onat A, Laatikainen T, et al. Comparison of various surrogate obesity indicators as predictors of cardiovascular mortality in four European populations. Eur J Clin Nutr. 2013;67:1298–302.
Google Scholar
-
Tabary M, Cheraghian B, Mohammadi Z, Rahimi Z, Naderian MR, Danehchin L, et al. Association of anthropometric indices with cardiovascular disease risk factors among adults: a study in Iran. Eur J Cardiovasc Nur. 2021;20:358–66.
Google Scholar
-
Wohlfahrt P, Somers VK, Cifkova R, Filipovsky J, Seidlerova J, Krajcoviechova A, et al. Relationship between measures of central and general adiposity with aortic stiffness in the general population. Atherosclerosis. 2014;235:625–31.
Google Scholar
-
Caleyachetty R, Thomas GN, Toulis KA, Mohammed N, Gokhale KM, Balachandran K, et al. Metabolically Healthy Obese and Incident Cardiovascular Disease Events Among 3.5 Million Men and Women. J Am Coll Cardiol. 2017;70:1429–37.
Google Scholar
-
Opio J, Croker E, Odongo GS, Attia J, Wynne K, McEvoy M. Metabolically healthy overweight/obesity are associated with increased risk of cardiovascular disease in adults, even in the absence of metabolic risk factors: A systematic review and meta-analysis of prospective cohort studies. Obes Rev. 2020;21:e13127.
Google Scholar
-
Käräjämäki AJ, Korkiakoski A, Hukkanen J, Kesäniemi YA, Ukkola O. Long-term metabolic fate and mortality in obesity without metabolic syndrome. Ann Med. 2022;54:1432–43.
Google Scholar
-
Eckel N, Meidtner K, Kalle-Uhlmann T, Stefan N, Schulze MB. Metabolically healthy obesity and cardiovascular events: A systematic review and meta-analysis. Eur J Prev Cardiol. 2016;23:956–66.
Google Scholar
-
Zheng R, Zhou D, Zhu Y. The long-term prognosis of cardiovascular disease and all-cause mortality for metabolically healthy obesity: a systematic review and meta-analysis. J Epidemiol Community Health. 2016;70:1024–31.
Google Scholar
-
Radholm K, Chalmers J, Ohkuma T, Peters S, Poulter N, Hamet P, et al. Use of the waist-to-height ratio to predict cardiovascular risk in patients with diabetes: Results from the ADVANCE-ON study. Diabetes Obes Metab. 2018;20:1903–10.
Google Scholar
-
Khalili S, Hatami M, Hadaegh F, Sheikholeslami F, Azizi F. Prediction of Cardiovascular Events with Consideration of General and Central Obesity Measures in Diabetic Adults: Results of the 8.4-Year Follow-Up. Metab Syndr Relat D. 2012;10:218–24.
Google Scholar
-
Wang C, Yuan Y, Zheng M, Pan A, Wang M, Zhao M, et al. Association of Age of Onset of Hypertension With Cardiovascular Diseases and Mortality. J Am Coll Cardiol. 2020;75:2921–30.
Google Scholar
-
Wang X, Feng B, Huang Z, Cai Z, Yu X, Chen Z, et al. Relationship of cumulative exposure to the triglyceride-glucose index with ischemic stroke: a 9-year prospective study in the Kailuan cohort. Cardiovasc Diabetol. 2022;21:66.
Google Scholar
-
Tian X, Wang P, Chen S, Zhang Y, Zhang X, Xu Q, et al. Association of serum uric acid to lymphocyte ratio, a novel inflammatory biomarker, with risk of stroke: A prospective cohort study. CNS Neurosci Ther. 2023;29:1168–77.
Google Scholar
-
Arnett DK, Blumenthal RS, Albert MA, Buroker AB, Goldberger ZD, Hahn EJ, et al. 2019 ACC/AHA Guideline on the Primary Prevention of Cardiovascular Disease: Executive Summary: A Report of the American College of Cardiology/American Heart Association Task Force on Clinical Practice Guidelines. J Am Coll Cardiol. 2019;74:1376–414.
Google Scholar
-
Grundy SM, Stone NJ, Bailey AL, Beam C, Birtcher KK, Blumenthal RS, et al. 2018 AHA/ACC/AACVPR/AAPA/ABC/ACPM/ADA/AGS/APhA/ASPC/NLA/PCNA Guideline on the Management of Blood Cholesterol: Executive Summary: A Report of the American College of Cardiology/American Heart Association Task Force on Clinical Practice Guidelines. J Am Coll Cardiol. 2019;73:3168–209.
Google Scholar
-
Goff DC Jr, Lloyd-Jones DM, Bennett G, Coady S, D’Agostino RB, Gibbons R, et al. 2013 ACC/AHA guideline on the assessment of cardiovascular risk: a report of the American College of Cardiology/American Heart Association Task Force on Practice Guidelines. Circulation. 2014;129:S49–73.
Google Scholar
-
Stroke–1989. Recommendations on stroke prevention, diagnosis, and therapy. Report of the WHO Task Force on Stroke and other Cerebrovascular Disorders. Stroke. 1989;20:1407–31.
Google Scholar
-
Tunstall-Pedoe H, Kuulasmaa K, Amouyel P, Arveiler D, Rajakangas AM, Pajak A. Myocardial infarction and coronary deaths in the World Health Organization MONICA Project. Registration procedures, event rates, and case-fatality rates in 38 populations from 21 countries in four continents. Circulation. 1994;90:583–612.
Google Scholar
-
Zhao Y, Qie R, Han M, Huang S, Wu X, Zhang Y, et al. Association of BMI with cardiovascular disease incidence and mortality in patients with type 2 diabetes mellitus: A systematic review and dose-response meta-analysis of cohort studies. Nutr Metab Cardiovasc Dis. 2021;31:1976–84.
Google Scholar
-
Iliodromiti S, Celis-Morales CA, Lyall DM, Anderson J, Gray SR, Mackay DF, et al. The impact of confounding on the associations of different adiposity measures with the incidence of cardiovascular disease: a cohort study of 296 535 adults of white European descent. Eur Heart J. 2018;39:1514–20.
Google Scholar
-
Bae JC, Cho NH, Kim JH, Hur KY, Jin SM, Lee MK. Association of Body Mass Index with the Risk of Incident Type 2 Diabetes, Cardiovascular Disease, and All-Cause Mortality: A Community-Based Prospective Study. Endocrinol Metab (Seoul). 2020;35:416–24.
Google Scholar
-
Eckel N, Li Y, Kuxhaus O, Stefan N, Hu FB, Schulze MB. Transition from metabolic healthy to unhealthy phenotypes and association with cardiovascular disease risk across BMI categories in 90 257 women (the Nurses’ Health Study): 30 year follow-up from a prospective cohort study. Lancet Diabetes Endocrinol. 2018;6:714–24.
Google Scholar
-
Xue R, Li Q, Geng Y, Wang H, Wang F, Zhang S. Abdominal obesity and risk of CVD: a dose-response meta-analysis of thirty-one prospective studies. Br J Nutr. 2021;126:1420–30.
Google Scholar
-
Kruszewska J, Cudnoch-Jedrzejewska A, Czarzasta K. Remodeling and Fibrosis of the Cardiac Muscle in the Course of Obesity-Pathogenesis and Involvement of the Extracellular Matrix. Int J Mol Sci. 2022;23:4195.
Google Scholar
-
Gutierrez-Cuevas J, Sandoval-Rodriguez A, Meza-Rios A, Monroy-Ramirez HC, Galicia-Moreno M, Garcia-Banuelos J, et al. Molecular Mechanisms of Obesity-Linked Cardiac Dysfunction: An Up-Date on Current Knowledge. Cells. 2021;10:629.
Google Scholar
-
Rothman KJ, Poole C. A strengthening programme for weak associations. Int J Epidemiol. 1988;17:955–9.
Google Scholar
Acknowledgements
We thank all study participants, their relatives, the members of the survey teams at the 11 regional hospitals of the Kailuan Medical Group; and the project development and management teams at the Beijing Tiantan Hospital and the Kailuan Group. This work was supported by National Key Research and Development Program of China (2022YFC3600600), Fund for Young Talents of Beijing Medical Management Center (QML20230505), National Natural Science Foundation of China (81773512), and Beijing Municipal Administration of Hospitals Incubating Program (PX2020021).
Author information
Authors and Affiliations
Contributions
HL, and YesongLiu drafted the manuscript and conducted the statistical analysis. XT revised the manuscript for intellectual content and interpreted the data. YZ, LL, ZZ, and LL interpreted the data. YZ and XJ collected the epidemiological and clinical data. YLiu, YLuo, and AW designed the study, had full access to all the data and take responsibility for the integrity of the data and the accuracy of the data analysis. All authors approved the final version.
Corresponding authors
Ethics declarations
Competing interests
The authors declare no competing interests.
Additional information
Publisher’s note Springer Nature remains neutral with regard to jurisdictional claims in published maps and institutional affiliations.
Supplementary information
Supplementary material
Rights and permissions
Springer Nature or its licensor (e.g. a society or other partner) holds exclusive rights to this article under a publishing agreement with the author(s) or other rightsholder(s); author self-archiving of the accepted manuscript version of this article is solely governed by the terms of such publishing agreement and applicable law.
Reprints and Permissions
About this article
Cite this article
Luo, H., Liu, Y., Tian, X. et al. Association of obesity with cardiovascular disease in the absence of traditional risk factors.
Int J Obes (2023). https://doi.org/10.1038/s41366-023-01408-z
-
Received: 06 November 2022
-
Revised: 19 October 2023
-
Accepted: 27 October 2023
-
Published: 08 November 2023
-
DOI: https://doi.org/10.1038/s41366-023-01408-z