
Blood
ABO and Rh blood groups and risk of infection: systematic review and meta-analysis
Nov
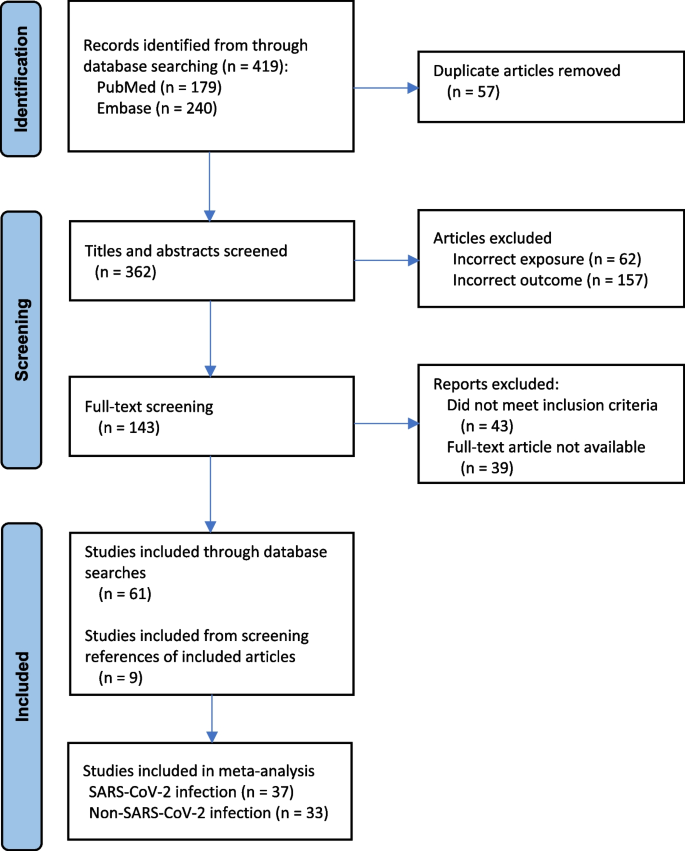
A total of 419 articles were identified through the database searches, and 57 duplicates were removed. The titles and abstracts of the remaining 362 articles were screened, of which 219 were excluded at this phase. One hundred and forty-three articles underwent full-text review, of which 82 were then excluded at this next phase. The references of the remaining 61 articles were searched for additional publications, of which two additional studies of SARS-CoV-2 infection and seven additional studies of non-SARS-CoV-2 infection were added. Hence, in total, 70 articles (37 investigating SARS-CoV-2 infection and 33 investigating other viral and non-viral infections) were included (Fig. 1).
PRISMA flow diagram of study selection and inclusion
ABO and SARS-CoV-2 infection
Out of 37 studies investigating SARS-CoV-2 infections, 22 were case–control and 15 cohort designs (Tables S2 and S3). The demographics of the study participants differed widely, as did the definition of SARS-CoV-2, including varying degrees of severity (severe, minimal symptoms, or asymptomatic SARS-CoV-2 infection) (Table S2). The ORp of SARS-CoV-2 infections among case–control studies comparing non-O vs. O blood groups was 2.13 (95% CI 1.49 to 3.04; I2 98.94%) (Fig. 2a). Among the cohort studies comparing non-O vs. O-blood groups, the ORp for SARS-CoV-2, was 1.89 (95% CI 1.56 to 2.29; I2 97.88%) (Fig. 2b).

a Risk of SARS-CoV-2 infection comparing non-O vs. O blood groups, among case–control studies. b Risk of SARS-CoV-2 infection comparing non-O vs. O blood groups, among cohort studies
ABO and non-SARS-CoV-2 infections
There were 33 non-SARS-CoV-2 studies, 17 of which were case–control and 16 cohort designs (Tables S4 and S5). These studies evaluated various forms of viral hepatitis (5 studies), malaria (5 studies), rotavirus gastroenteritis (4 studies), tuberculosis (3 studies), Helicobacter pylori (2 studies), JC polyomavirus (2 studies), with the remainder investigating other bacterial, viral, fungal, and parasitic infections (Table S4).
Among 17 case–control studies, the ORp for other viral and non-viral infections comparing non-O vs. O blood groups was 1.98 (95% CI 1.49 to 2.65; I2 73.30%) and 1.56 (95% CI 0.98 to 2.46; I2 96.56%), respectively (Fig. 3a). Among 16 cohort studies comparing non-O vs. O-blood groups, the ORp was 1.87 (95% CI 1.53 to 2.29; I2 89.50%) for other viral infection (Fig. 3b), and 2.11 (95% CI 1.67 to 6.67; I2 73.96%) for non-viral infection (Fig. 3b).

a Risk of non-SARS-CoV-2 infections comparing non-O vs. O blood groups, among case–control studies. Shown are studies of viral infections (upper) and non-viral infections (lower). b Risk of non-SARS-CoV-2 infections comparing non-O vs. O blood groups, among cohort studies. Shown are studies of viral infections (upper) and non-viral infections (lower)
Rh(D) and SARS-CoV-2 infection
Five case–control studies investigated SARS-CoV-2 infection related to Rh status (Table S2). Comparing Rh-positive to Rh-negative persons, the ORp was 13.83 (95% CI 6.18 to 30.96; I2 96.16%) (Fig. 4). Among six cohort studies, the corresponding ORp was 19.04 (95% CI 11.63 to 31.17; I2 97.04%) (Fig. 4).

Risk of SARS-CoV-2 infection comparing Rh-positive vs. Rh-negative status, amongcase-control studies (upper) and cohort studies (lower)
Rh(D) and non-SARS-CoV-2 infections
Seven case–control studies investigated non-SARS-CoV-2 infections in relation to Rh status (Table S4). Comparing Rh-positive vs. Rh-negative blood, the ORp was 23.45 (95% CI 16.28 to 33.76; I2 72.45%) (Fig. 5). Among four cohort studies, the ORp was 9.25 (95% CI 2.72 to 31.48; I2 98.19%) (Fig. 5). No delineation was made herein between other viral and non-viral infection, due to too few studies.

Risk of non-SARS-CoV-2 infections comparing Rh-positive vs. Rh-negative status, among case–control studies (upper) and cohort studies (lower)
Additional analyses
There were 15 cohort studies completed in 11 different countries of O and non-O blood group and risk of SARS-CoV-2 infection. Compared to the referent country of Denmark, that conducted in Turkey showed a relatively higher OR of SARS-Cov-2 among patients with non-O vs. O blood group [12] (Figure S1). For non-SARS-CoV-2 infections, there were 17 cohort studies in 11 countries. Compared to Hong Kong, countries such as Thailand, Mali, the United Kingdom, India, Papa New Guinea, Turkey, and Egypt showed a relatively higher odds of infection among patients with non-O vs. O blood groups (Figure S2).
Among cohort studies of SARS-CoV-2 infection, as mean age increased, the OR of SARS-CoV-2 did not differ between patients with non-O vs. O blood groups (p = 0.46) (Figure S3). However, for non-SARS-CoV-2 infections, the OR of non-SARS-CoV-2 infection decreased with age (p < 0.001) (Figure S4).