
Cancer and neoplasms
The relation between obesity and breast cancer risk in women by considering menstruation status and geographical variations: a systematic review and meta-analysis
Jul
Identification and description of the studies
One hundred and two studies were included in this meta-analysis. Forty eight studies reported an association between obesity and breast cancer in pre-menopausal women, and 67 studies showed a relationship between obesity and breast cancer in post-menopausal women. 34 studies (4 cross-sectional,18 case–control, and 12 cohort) with a total sample size of 60,985 cases and 48,720 controls were used to evaluate the relation between obesity and breast cancer, without distinguishing between pre-menopausal and post-menopausal women.
Fifteen studies were conducted in North America, 21 in Asia, 8 in Europe, 2 in Africa, 1 in South America for the pre-menopause period. Twenty three studies were conducted in North America, 27 in Asia, 10 in Europe, 2 in Africa, 3 in South America and 1 in Oceania for the post-menopause period. We aimed to pool the findings of the research in this analysis individually depending on the subgroup of studies that measured the relation between obesity and breast cancer before and after menstruation. Table 1s describes the features of each study included in this systematic review and meta-analysis.
Quality assessment and risk of bias
In this meta-analysis, the quality of case–control, cohort, and cross-sectional studies was examined by using the Newcastle–Ottawa scale (NOS), the results of which were presented in the checklists completed based on the type of study. The quality assessment checklists of the case–control and cohort studies showed that most of these studies had a moderate to high-quality score (Table 1s).
Relationship between obesity and breast cancer risk in pre-menopausal women
Forty eight studies (two cross-sectional, 35 case–control, and 11 cohort) with a total sample size of 66,999 cases and 845,612 controls were included in the evaluation of the association between obesity and breast cancer in pre-menopausal women. Regardless of the type of study, the lowest and highest ORs were equal to 0.44 (95% CI; 0.19 – 1.01) and 2.73 (95% CI; 1.79 – 4.18), respectively. After combining all studies, the pooled OR of the association between obesity (with case group BMI > 30) and breast cancer in pre-menopause was OR = 0.93 CI: (0.85–1.1), I2 = 65.4%, P < 0.001 (Fig. 2). It showed that obesity was not a significant protective factor for breast cancer in pre-menopause women. Visual inspection of the funnel plot in Fig. 5a, indicated asymmetry, but Egger’s tests (β =—0.071, P-value = 0.85), did not show significant publication bias. When the trim and fill approach was used to further evaluate publication bias, no study was imputed. The result of the meta-regression analysis described that the study quality and a sample size of more than 1000 had no significant linear relationship with the OR of obesity and breast cancer risk, so these variables were not the reason for the heterogeneity (Table 1).
Meta-analysis of the relation between obesity and breast cancer risk in pre-menopausal women
Sensitivity analysis showed that the pooled effect size on the relationship between obesity and breast cancer risk in pre-menopause women did not depend on a single study (CI range: 0.84- 1.01).
Relationship between obesity and breast cancer risk in post-menopausal women
Sixty seven studies (three cross-sectional, 46 case–control, and 18 cohort) with a total sample size of 262,434 cases and 1,501,879 controls were used in the evaluation of the association between obesity and breast cancer risk in post-menopausal women. Regardless of the type of study, the lowest and highest ORs were equal to 0.56 (95% CI; 0.33 – 0.99) and 3.26 (95% CI; 1.54 – 6.9), respectively. After combining all studies, the pooled OR of the relation between obesity and breast cancer risk in post-menopausal women was OR = 1.26 CI: (1.19–1.34), I2 = 90.5%, P < 0.001(Fig. 3). It showed a higher probability of developing breast cancer by up to 26% in obese post-menopausal women. The funnel plots (Fig. 5b) for these studies provided substantial evidence of publication bias, but with the Egger test, a significant publication bias was not seen (β = 0. 78, P-value = 0.103). The trim-and-fill method used for more certainty (Fig. 6a), showed that 11 assumptive missing papers have been imputed, and the “adjusted” point estimate indicated a comparable OR compared to the original analysis (OR = 1.20, 95% CI: 1.13–1.27). The result of the meta-regression analysis indicated that the probability of having breast cancer in obese women increased with an increase in study quality and sample size, but this association was not statistically significant. Therefore, study quality and a sample size of more than 1000 were not the reasons for the heterogeneity.

Meta-analysis of the relation between obesity and breast cancer risk in post-menopausal women
Sensitivity analysis showed that the pooled effect size on the relationship between obesity and breast cancer risk in post-menopausal women did not depend on a single study (CI range: 1.18–1.34).
Relationship between obesity and breast cancer risk regardless of menstrual status
The data from 34 studies (Four cross-sectional,18 case–control, and 12 cohort) with a total sample size of 34,962 cases and 2,076,826 controls were included in the evaluation of the relation between obesity and breast cancer risk, without distinguishing between pre-menopausal and post-menopausal women. After combining all studies, the pooled OR of the association between obesity and breast cancer was OR = 1.29 CI: (1.18–1.42), I2 = 84.9%, P < 0.001(Fig. 4). We observed an asymmetry based on a visual assessment of the funnel plot (Fig. 5c); however, no significant publication bias was indicated using Egger’s test (β = 0.45, P-value = 0.75). Using the trim-and-fill procedure showed that 10 assumptive missing papers have been imputed, and after being included, the “adjusted” point estimate indicated a similar OR to the original analysis (OR = 1.13, 95% CI: 1.02—1.24) (Fig. 6b). According to the meta-regression analysis, study quality and a sample size of more than 1000 were not the reasons for the heterogeneity.

Meta-analysis of the relation between obesity and breast cancer risk in all women regardless of their menstrual status

Funnel plots for publication bias in pre-menopause studies (a), in post-menopause studies (b) and studies regardless of menstrual status (c)

Trim-filled funnel plots for post-menopausal studies (a) and studies regardless of menstrual status (b)
Sensitivity analysis indicated that the pooled effect size on the relationship between obesity and breast cancer risk did not depend on a single study (CI range: 1.17–1.42).
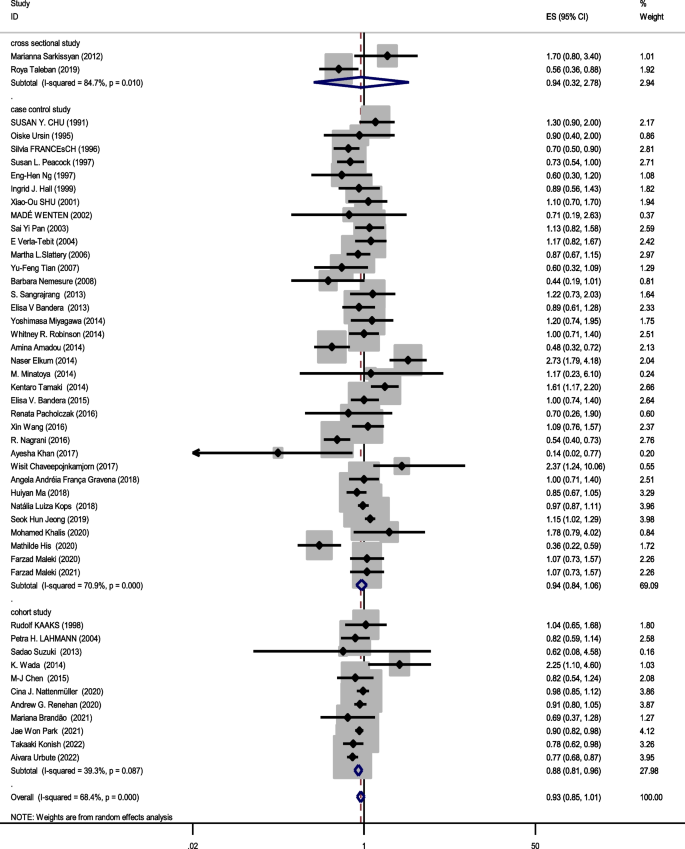
Subgroup analysis based on combining menstrual status
Figures 2, 3 and 4 shows subgroup analysis irrespective of the type of study. The findings showed that obesity was linked to a decreased risk of breast cancer in pre-menopausal women across all study types. In the case–control papers, obese women had a 6% lower risk of breast cancer than normal-weight women (OR = 0.94, 95% CI: 0.84–1.06; I2: 70.9%; P-value 0.001), although this difference was not statistically significant. Also, in the cross-sectional studies (OR = 0.94, 95% CI: 0.32–2.78; I2: 84.7%; P-value < 0.001), obese women had a 6% lower risk of breast cancer than normal-weight women. There is a strong link between obesity and breast cancer in the pre-menopause period, according to cohort studies (OR = 0.88, 95% CI: 0.81–0.96; I2: 39.3%; P-value = 0.0.87). Case–control studies that explored the correlation between obesity and breast cancer risk in post-menopausal women reported that being overweight significantly increases the probability of developing the disease (OR = 1.27, 95% CI: 1.17–1.37; I2: 87.3%; P-value 0.001). It means that obese women have a 27% more chance of breast cancer in post-menopause relative to normal-weight women. Moreover, cross-sectional studies and cohort studies both showed a stronger link between obesity and breast cancer risk in post-menopausal women (OR = 1.31, 95% CI: 0.75–2.27; I2: 97.3%; P-value 0.001), and OR = 1.29, 95% CI: 1.16–1.43, respectively.
Combining the results of the studies that showed the relation between obesity and breast cancer risk regardless of menstrual status, the results of subgroups showed that case–control studies (OR = 1.38, 95% CI: 1.22–1.57; I2: 80.3%; P-value < 0.001), cohort studies (OR = 1.22, 95% CI: 1.03–1.45; I2: 84.9%; P-value = 0.0001) and cross-sectional studies (OR = 1.25, 95% CI: 0.8–1.96; I2: 89.6%; P-value < 0.001) report increased association between obesity and breast cancer risk.
Table 2 shows the results of the relation between obesity and breast cancer risk by geographic location of where the study was conducted. The result showed that Asian (OR = 1.49, 95% CI: 1.32–1.69; I2: 94.7%; P-value < 0.001) and North American (OR = 1.21, 95% CI: 1.07–1.36; I2: 75.5%; P-value < 0.001) obese woman in post-menopause were more likely to develop breast cancer than the European ones (OR = 1.10, 95% CI: 0.97–1.25; I2: 85%; P-value = 0.0001). The relation between obesity and breast cancer risk in post-menopause was not significant in European women. According to the different I2 tests in subgroup analysis based on geographic location, the difference in the geographical location of the studies is one of the reasons for the heterogeneity. Obesity was not a significant factor for breast cancer risk in pre-menopause in Asians (OR = 1.00, 95% CI: 0.87–1.15; I2: 76.71%; P-value < 000.1), and North Americans (OR = 1.07, 95% CI: 0.42–2.69; I2: 69.7%; P-value = 0.069). In European women, obesity was a significant protective factor for breast cancer risk in pre-menopause (OR = 0.88, 95% CI: 0.79–0.98 I2: 44.8%; P-value = 0.081).