
Cardiovascular
Metabolic systems approaches update molecular insights of clinical phenotypes and cardiovascular risk in patients with homozygous familial hypercholesterolemia
Jul
Demographic and clinical characteristics of all participants
A total of 660 individuals participated in the discovery cross-sectional study (Fig. 1a), including 184 genetically confirmed HoFH patients (male, 50.1%), 376 HeFH patients (male, 49.2%), and 100 non-FH individuals (male, 53.0%). The clinical characteristics of the study individuals are presented in Table 1. Patients with HoFH had higher levels of LDL-C, TC, non-HDL, Lp(a), and APOB and lower levels of HDL and APOA1 than HeFH and non-FH individuals. In addition, HoFH patients had a higher prevalence ratio of corneal arcus, xanthomas, and aortic stenosis than HeFH and non-FH subjects. A total of 48 HoFH patients (male, 43.8%), 110 HeFH patients (male, 46.4%), and 50 non-FH subjects (male, 52%) from another independent multi-center institution constituted the validation cohort (Fig. 1a). As shown in Additional file 2: Table S1, the alterations in the clinical lipid profiles and the prevalences of HoFH-associated clinical complications between different groups in the validation cohort were similar to those in the discovery cohort. The detailed LLT information on both cohorts is summarized in Additional file 2: Table S2. Most of patients with HoFH had received at least two LDL-C-lowering medications.
HoFH, HeFH, and non-FH subjects show distinct serum metabolite profiles
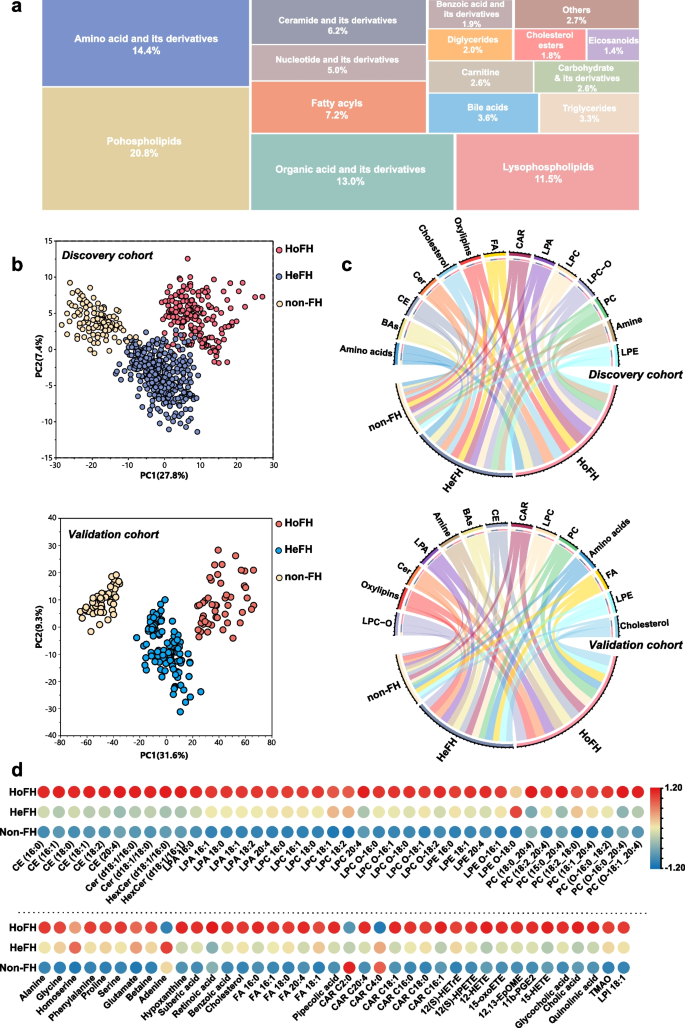
After data preprocessing, a total of 885 circulating metabolites were identified in the untargeted metabolomic and lipidomic profiling, including 325 chemical standard-annotated metabolites. The full list of the annotated metabolites is listed in Additional file 3. These metabolites mainly consisted of amino acid and its derivatives, organic acids, fatty acyls, bile acids, carbohydrate and its derivatives, eicosanoids, nucleotide and its derivates, carnitine, ceramide and its derivatives, cholesterol esters, diglycerides, triglycerides, phospholipids, and lysophospholipids (Fig. 2a). Furthermore, the unsupervised PCA score plot of QC samples and the relative standard derivations of the distribution for the identified metabolites in the QC samples are shown in Additional file 2: Fig. S1 a–d, and the results indicated that the proposed LC–MS approach was robust and reproducible for further analysis.
Pattern analysis of the dataset from the serum metabolome and lipidome profiling. a Treemap overview for the metabolic category distribution of annotated metabolites based on untargeted metabolomic/lipidomic analyses. b PCA score plot of the metabolic profiling data from serum samples of HoFH patients, HeFH patients, and non-FH individuals in the discovery and validation cohorts; each point represents an individual serum sample. c Chord diagram of the major differentiated metabolic classes across the HoFH, HeFH, and non-FH groups from the discovery and validation cohorts; the width of the curves indicates the mean percentage of each metabolic class between the study groups. Each color represents a unique metabolite class. d Heatmap of the differentiated metabolites that distinguished HoFH patients from HeFH and non-FH individuals in discovery cohort. HoFH homozygous familial hypercholesterolemia, HeFH heterozygous familial hypercholesterolemia, non-FH non-familial hypercholesterolemia, FA fatty acids, CE cholesterol esters, Cer ceramide, CAR acyl carnitines, LPA lysophosphatidic acid, LPI lysophosphatidylinositol, PC diacylglycerophosphocholines, LPC lyso PC, LPC-O alkyl-LPC, LPE lysophosphoethanolamines, LPE-O alkyl-LPE
To test whether the metabolic profiling could discriminate HoFH patients, HeFH patients, and non-FH individuals, we employed PCA analysis designed to distinguish the group separation. Based on the cumulative Q2 and R2 values, PCA models of the discovery and validation cohorts were established based on eight PCs and nine PCs, respectively. The two established PCA models were highlighted with satisfactory values of cumulative R2 and Q2 (discovery cohort: R2 = 0.58, Q2 = 0.52; validation cohort: R2 = 0.69, Q2 = 0.61), indicating good explanatory and predictive ability (Additional file 2: Fig. S1 e, f). The first two PC-based PCA score plots are depicted in Fig. 2b. In the discovery cohort, a clear clustering trend from non-FH individuals to patients with HeFH to those with HoFH was observed. Furthermore, a similar group separation trend among HoFH, HeFH, and non-FH was also observed in the validation cohort. These results indicated that the metabolite profiles of HoFH were significantly different from those of non-FH and HeFH.
HoFH is characterized by profound serum metabolite alterations
To maximize the group separation and identify the differentially expressed metabolites that distinguish HoFH from non-FH and HeFH in the discovery cohort, the supervised PLS-DA models were constructed. The performance measure plots of LOOCV showed that the first three components were best for establishing PLS-DA models for differentiating HoFH from non-FH and HeFH (Additional file 2: Fig. S2a). The reliability of the established PLS-DA models was confirmed by the permutations plot and highlighted with significant CV-ANOVA P values (all P values < 0.0001; Additional file 2: Fig. S2b). The first two components-based PLS-DA score plots revealed a distinct separation of the sera metabolite profiles of HoFH patients from non-FH and HeFH individuals in the discovery cohort (Additional file 2: Fig. S2c). Then, the combined VIP and p(corr) plots of PLS-DA models were constructed to identify the important metabolic variables responsible for group separation (Additional file 2: Fig. S2d). Finally, we identified a panel of 79 serum metabolites that could significantly differentiate HoFH patients from HeFH and non-FH subjects in the discovery cohort (summarized in Additional file 2: Table S3). Furthermore, the findings obtained from PLS-DA analysis were also confirmed by the univariate analysis, as shown in the volcano plots (Additional file 2: Fig. S2e).
Next, we performed PLS-DA analysis to test the discriminatory performances of the differentiated metabolites obtained from the discovery cohort in differentiating HoFH from non-FH and HeFH in the validation cohort. The optimal number of components for building PLS-DA models were selected using the LOOCV plot (Additional file 2: Fig. S3a). We found that the cumulative Q2 values and accuracies of the first two components in two PLS-DA models were greater than 0.9, and the resultant PLS-DA score plots revealed a clear separation between HoFH and non-FH/HeFH in the validation cohort (Additional file 2: Fig. S3b). Furthermore, the optimal numbers of PLS-DA components-based posterior classification probability plots demonstrated that no HoFH individuals were predicted as non-FH or HeFH individuals in the validation cohort (Additional file 2: Fig. S3c). The reliability of the established PLS-DA models was also confirmed by the permutations plot (n = 1000 times; P values < 0.000001; Additional file 2: Fig. S3d). These findings revealed that the differentiated metabolites identified in the discovery cohort could also accurately differentiate HoFH from non-FH and HeFH in the validation cohort.
The relative percentages of major metabolic categories and mean normalized levels of differentiated metabolites were plotted as chord diagrams and heatmaps (Fig. 2b, c; Additional file 2: Fig. S3e). From the resultant graphs, it was evident that the expression levels of these differentiated metabolites in HoFH were distinct from those of HeFH and non-FH subjects in both cohorts. HoFH patients had higher levels of amino acids, fatty acids (FA), eicosanoids, cholesterol esters (CE), ceramide (Cer), lysophosphatidic acid (LPA), lysophosphoethanolamine (LPE), acyl carnitine (CAR), diacylglycerophosphocholine (PC), lysophosphocholine (LPC), alkyl-LPC (LPC-O), and bile acids.
Considering that LLT and existing ASCVD are potential metabolic regulatory factors affecting the serum metabolome and lipidome, we employed unsupervised PCA and supervised orthogonal PLS-DA analysis to assess their potential effects on the identified metabolite markers that differentiated HoFH from HeFH and non-FH. As shown in Additional file 2: Fig. S4 a–d, the metabolic alterations did not show clustering of samples by LLT status or ASCVD history in both unsupervised and supervised MVA models, indicating no discriminatory metabolite features due to differences in LLT status or ASCVD history of the study groups. The associations between these discriminatory metabolites and the clinical lipids were performed by using Spearman’s rank correlation coefficients. As expected, most of the altered small-molecule lipids that distinguished HoFH from HeFH and non-FH were strongly associated with clinical lipid makers, including LDL-C, TC, APOB, APOA1, Lp(a), HDL-C, and non-HDL (Additional file 2: Fig S4 e).
HoFH-associated metabolites are implicated in a variety of metabolic and functional pathways
To factually characterize the HoFH-perturbed metabolic pathways, MetaboAnalyst-based quantitative pathway enrichment analysis was performed using the quantitative matrix of the differentiated metabolites between groups. The enriched metabolic pathways and associated metabolites are summarized in Fig. 3a and Additional file 4, respectively. In the discovery cohort, the results indicated that the metabolites distinguishing HoFH patients from HeFH and non-FH individuals were significantly enriched in lipid metabolism pathways, including arachidonic acid metabolism, phospholipid metabolism, sphingolipid metabolism, and biosynthesis pathways of steroid, bile acids, carnitine, plasmalogen, and fatty acids. In addition, three hydrophilic metabolite markers (including glycine, alanine, and glutamate) were significantly enriched in the urea cycle, purine metabolism, and several amino acid metabolism pathways (Additional file 4). Furthermore, we demonstrated that the differentiated metabolites obtained from the validation cohort also showed similar influences (enrichment ratios) on the enriched pathways with high impact significance (all FDR-adjusted P values < 0.05; Fig. 3a). To further understand the biological function and latent diseases of HoFH-associated metabolites, a functional relationship network analysis was performed using the IPA knowledge database. The results revealed that those HoFH-altered metabolites were primarily associated with cholesterol homeostasis, oxidative stress, inflammation, and ASCVD progression (Fig. 3b). Most strikingly, the accumulation of FA species, CE species, CAR species, and lysophospholipids in the serum of HoFH patients was closely associated.

Pathway enrichment and clinical phenotype-correlation analyses of metabolic signatures. a Expression level-based quantitative pathway enrichment analysis of the differentiated metabolites that distinguished the HoFH group from the non-FH and HeFH groups. The bubble size refers to the enrichment ratio of the pathway and the color represents the natural log of the FDR-adjusted P value. b IPA-based functional network between the HoFH-associated metabolites and enriched biological pathways/diseases. Rectangles, nodes, and edges represent metabolites, functional pathways/diseases, and associations, respectively. c Correlation plot depicting the correlation of clinical lipids with corneal arcus/xanthomas, supravalvular aortic stenosis, and valvular aortic stenosis, using regression analyses (FDR-adjusted *P < 0.05; FDR-adjusted **P < 0.01). d–f Correlation plot depicting the relation of metabolomic features with corneal arcus/xanthomas, supravalvular aortic stenosis, or valvular aortic stenosis (FDR-adjusted *P < 0.05; FDR-adjusted **P < 0.01). LDL-C low-density lipoprotein cholesterol, HDL-C high-density lipoprotein cholesterol, Lp(a) lipoprotein (a), ApoA1 apolipoprotein A1, ApoB apolipoprotein B. Other abbreviations are shown in Fig. 1
Inflammatory and oxidative stress-related metabolites are correlated with corneal arcus and xanthomas
Corneal arcus and xanthomas are typical characteristics in HoFH individuals. Among the 232 HoFH patients in the discovery and validation cohorts, a total of 106 HoFH patients presented with corneal arcus, and all of them also presented with xanthomas. Using the merged datasets obtained from discovery and validation cohorts, we used regression analysis to assess the correlations of clinical lipids with corneal arcus/xanthomas. Although excess cholesterol (LDL-C and TC) promoting the formation of corneal arcus and xanthomas in HoFH had been well recognized [11], the results of regression analysis demonstrated that LDL-C, TC, and APOB only showed a non-statistically positive correlation with corneal arcus and xanthomas (all P value > 0.05; Fig. 3c). However, we found that age (β-coefficient = 0.458, P = 0.003), Lp(a) (β-coefficient = 0.44, P = 0.005), and HDL-C (β-coefficient = − 0.376, P = 0.05) were positively associated with the prevalence of the corneal arcus and xanthomas.
Next, we performed univariate regression analyses to test whether HoFH-associated serum metabolites were associated with xanthomas and corneal arcus using the merged datasets from the discovery and validation cohorts. The results revealed that 15 metabolites (mainly including FA species, short-chain CAR species, LPA species, and arachidonic acid-derived oxylipins) were associated with corneal arcus and xanthomas (Additional file 2: Table S4). After adjustments for age, sex, and clinical lipids, ten of them remained correlated with corneal arcus and xanthomas (as summarized in Fig. 3d). Notably, a panel of pro-inflammatory metabolites (including LPC 20:4, LPA 18:1, LPA 20:4, 11b-PGE2, and 15-oxoETE) were positively associated (β-coefficient values ranging from 0.328 to 0.653, all P values < 0.05; Additional file 2: Table S4).
Metabolic alterations in arachidonic acid and lysophospholipid metabolism show significant associations with aortic stenosis
Aortic stenosis, including supravalvular aortic stenosis (SVAS) or calcific valvular aortic stenosis (VAS), is a major long-term complication of HoFH [18]. In regression analysis, our results demonstrated that LDL-C, TC, APOB, non-HDL, and Lp(a) showed positive correlations with SVAS (all P values < 0.05, Fig. 3c). Regarding to calcific VAS, we found that ages (β-coefficient = 0.161), male sex (β-coefficient = 0.528), and Lp(a) (β-coefficient = 0.469) was positively associated (all P values < 0.05), whereas LDL-C, TC, non-HDL, and APOB only showed a non-statistically positive correlation with VAS. Additionally, we found that HDL-C and APOA1 were negatively associated with SVAS and calcific VAS (Fig. 3c).
Then, we performed univariate and multivariate regression analyses to explore the associations of HoFH-altered metabolites with SVAS and calcific VAS. A panel of inflammation-related metabolites was found to be positively associated with SVAS and calcific VAS (Additional file 2: Tables S5, S6). Our results demonstrated that six lysophospholipids (including LPC 20:4, LPC 18:0, LPE O-16:1, LPE O-18:0, LPA 20:4, and LPI 18:1) were significantly associated with SVAS (β-coefficient values ranging from 0.378 to 0.984, all P values < 0.05; Additional file 2: Table S5; Fig. 3e), even after adjustments for age, sex, and clinical lipids. In addition, our results indicated that arachidonic acid (FA 20:4), three LPA species (16:0, 18:0, and 18:2), and two arachidonic acid-derived oxylipins (11b-PGE2 and 15-HETE) were independently associated with calcific VAS (Additional file 2: Table S6; Fig. 3f). These findings indicated that the inflammation-related metabolites in the pathways of lysophospholipid and arachidonic acid metabolism might play a potential role in the progression of aortic stenosis.
HoFH patients with and without ASCVD events show less heterogeneity in routine clinical risk factors
The most important characteristic in HoFH is premature ASCVD [10, 11]. Among the 232 HoFH individuals in discovery and validation cohorts, 37 patients had a history of ASCVD events. In the regression analysis of the associations between clinical lipids and ASCVD, the results demonstrated that Lp(a) was positively associated with the presence of ASCVD, whereas APOA1 and HDL-C were negatively associated (Additional file 2: Fig. S5a). To investigate the roles of clinical factors in predicting the first ASCVD event, a total of 84 HoFH patients (mean age: 25.6 ± 11.5 years; males: 53.1%) with available follow-up were enrolled from the discovery cohort (Fig. 1b). After a median follow-up of 4.9 years (interquartile range: 4.0–5.3 years), ASCVD events occurred in 33 patients, including 26 myocardial infarction and 7 cardiac death cases. The baseline clinical and genetic characteristics of the study subjects are summarized in Table 2. Patients who developed ASCVD were more likely to have at least one LDLR null mutation and exhibited higher levels of Lp(a) and lower baseline levels of HDL-C and APOA1. Of note, there were no significant differences in baseline LDL-C levels, mean LDL-C levels at follow-up, LDL-C year scores, and LLT measures between patients with ASCVD events and event-survived individuals (Table 2). The subsequent Cox regression proportional-hazards analyses found that Lp(a), HDL-C, APOA1, and LDLR null mutations were significantly related to incident ASCVD events (Additional file 2: Fig. S5b).
Targeted metabolomics identifies significant metabolic alterations in HoFH patients with ASCVD events
Next, univariate and multivariate regression analyses were performed to investigate the associations of circulating metabolites with the presence of ASCVD in all studied HoFH patients. The results demonstrated that a panel of metabolites in the pathways of arachidonic acid metabolism, fatty acid metabolism, phospholipid metabolism, and carnitine metabolism were closely related to ASCVD (Additional file 2: Table S7). Furthermore, most of these metabolites were implicated in the processes of inflammation, oxidative stress, and atherosclerosis (Fig. 3b). We hypothesized that the serum metabolites might be used as cardiovascular risk factors for predicting ASCVD events in HoFH patients. In the untargeted metabolomic dataset of 84 HoFH patients in the follow-up study, a small panel of 22 chemical standard-annotated metabolites were identified to be differentially expressed at baseline (FDR-adjusted P value < 0.05) between subjects who developed ASCVD events and patients without events at follow-up (Additional file 2: Fig. S6). These altered metabolites are mainly dominated by lipid alterations in the pathways of fatty acid and carnitine biosynthesis, arachidonic acid metabolism, and phospholipid metabolism (Additional file 2: Table S8).
To verify the qualitative and quantitative accuracy for these altered metabolites, MRM-based targeted quantification and Pearson correlation analysis were performed. The quantitative levels of 22 metabolites were summarized in Fig. 4a. In the correlation analysis, the quantitative values of 20 metabolites showed a high correlation with their semi-quantitative levels obtained from untargeted metabolic profiling (correlation r coefficients ranging from 0.43 to 0.85, all P values < 0.001; Additional file 2: Fig. S7a). We also performed Spearman’s rank correlation and debiased sparse partial correlation network to explore the associations between the 22 differentiated metabolites. From the resultant correlograms (Additional file 2: Fig. S7 b, c), it was evident that most of these differentiated metabolites correlated with each other and acted in a coordinated manner. Furthermore, Cox regression analysis revealed that LDLR null mutations were positively associated with ASCVD events (Additional file 2: Fig. S5b). Interestingly, among the 52 patients with at least LDLR null mutation, we found that patients who developed ASCVD (n = 25) were more likely to have two LDLR null mutations (Additional file 2: Table S9) and presented higher sera concentrations of FA species, LPC species, CAR species, and arachidonic acid-derived oxylipins than those without ASCVD events (n = 27).

ASCVD-associated metabolite and protein alterations in the sera of HoFH patients. a Dot histogram of metabolite levels in HoFH patients with and without ASCVD events (concentration, nmol/mL). Mann–Whitney U test were used for each comparison. b Functionally grouped network of enriched pathways of differentiated proteins in patients with ASCVD events. c Enriched GO categories of differentiated proteins. BP biological process, CC cellular component, MP molecular function. d Topology analysis of pathway enrichment and impact from the joint pathway of differentially expressed proteins and metabolites. e Metabolite-protein interaction network. f Topology analysis of pathway enrichment and impact from the joint-pathway of differentially expressed proteins and metabolites. LPA 16:0 lysophosphatidic acid 16:0, LPC-O 18:0 lysophosphocholine alkyl − 18:0, LPC 20:4 lysophosphocholine 20:4, 12,13-EpOME 12,13-epoxyoctadecenoic acid, Cer (d18:1_16:0) Ceramide (d18:1_16:0). Other abbreviations are seen in Figs. 1 and 2
Integration of deep proteomics and metabolomics reveals a complex ASCVD-associated metabolic network
Next, we used a deep proteomic strategy with multi-nanoparticle protein corona to investigate the ASCVD-associated proteins and constructed the ASCVD-associated metabolic association network at multi-omic levels. Altogether, a total of 2304 proteins were identified and quantified. We found that 142 proteins were differentially expressed in the sera of patients with and without ASCVD events (Additional file 2: Fig. S8 a, b). According to the distribution of subcellular localization (Additional file 2: Fig. S8c), these differentiated proteins mainly included extracellular proteins (43.36%), nucleus proteins (16.78%), and cytoplasm proteins (15.38%). Pathway network and Gene Ontology (GO) enrichment analyses demonstrated that these differentiated proteins were mainly involved in the biological processes of small-molecular lipid transport and metabolism (e.g., arachidonic acid, glycerolipid, and cholesterol metabolism), lipid protein remodeling and related metabolism, platelet activation, and complement activation (Fig. 4 b, c).
To investigate the common metabolic pathways of differentially expressed proteins and metabolites, the joint-pathway enrichment and integration network analyses was performed based on MetaboAnalyst. The resultant plot revealed that arachidonic acid metabolism, glycerophospholipid metabolism, fatty acid synthesis, platelet activation, aldosterone synthesis, and ether lipid metabolism were significantly enriched (Fig. 4d). The integration network of key pathway-based metabolites and proteins is shown in Fig. 4e, including 13 proteins and seven metabolites.
Random Forest algorithm identifies a panel of metabolic/clinical features that shows significant performances in predicting ASCVD events
To select a small panel of important metabolic/clinical markers that can maintain a maximized performance in predicting ASCVD events, Random Forest (RF) algorithm was performed based on the integrated datasets of 22 differentiated metabolites and 16 clinical variables from the 84 HoFH patients. The variable importance of each metabolite and clinical measure was ranked by using the values of mean decrease accuracy and summarized in Fig. 5a. Then, the Monte Carlo cross validation (MCCV) analysis based on multivariable RF models was performed to select the optimal number of important variables. As shown in Fig. 5b and c, the combination of the top eleven features, including three clinical lipids (HDL-C, Lp(a), and APOA1) and eight metabolites (FA 20:4, LPC O-18:0, LPA 16:0, LPC 20:4, Cer (d18:1_16:0), 12,13-EpOME, 15-HETE, and CAR C18:1) and showed the powerful performance in predicting ASCVD events (AUC-ROC value = 0.933; predictive accuracy = 92.1%), while the additional features had little effect on the values of AUC-ROC and predictive accuracy (Fig. 5b, c). Notably, most of these eight metabolites were closely associated with inflammatory processes and atherosclerosis procession (as shown in Fig. 3b). Furthermore, Kaplan–Meier curve analysis (Fig. 5d) indicated that HoFH individuals with baseline concentrations of the top eight metabolites in the upper half had lower probability of ASCVD event-free survival than patients in the lower half (log-rank test P values ranging from 0.04 to 0.00048).

Selection of the optimal ASCVD-related metabolic/clinical variable panel by using Random Forest algorithm. a Top important ASCVD-associated variable selection by using the values of mean decrease accuracy in Random Forest analysis. b ROC curves generated from MCCV-based multivariate Random Forest models. The AUC-ROC value and its 95% CI are shown. c Predictive accuracies of multivariable Random Forest models with different numbers of top important variables. d Kaplan–Meier survival analysis of eight top important metabolites in HoFH patients with and without ASCVD events during the follow-up. Log-rank test P values are shown. LDLR status: at least one null mutation. Other abbreviations are shown in Table 2 and Figs. 2 and 3